

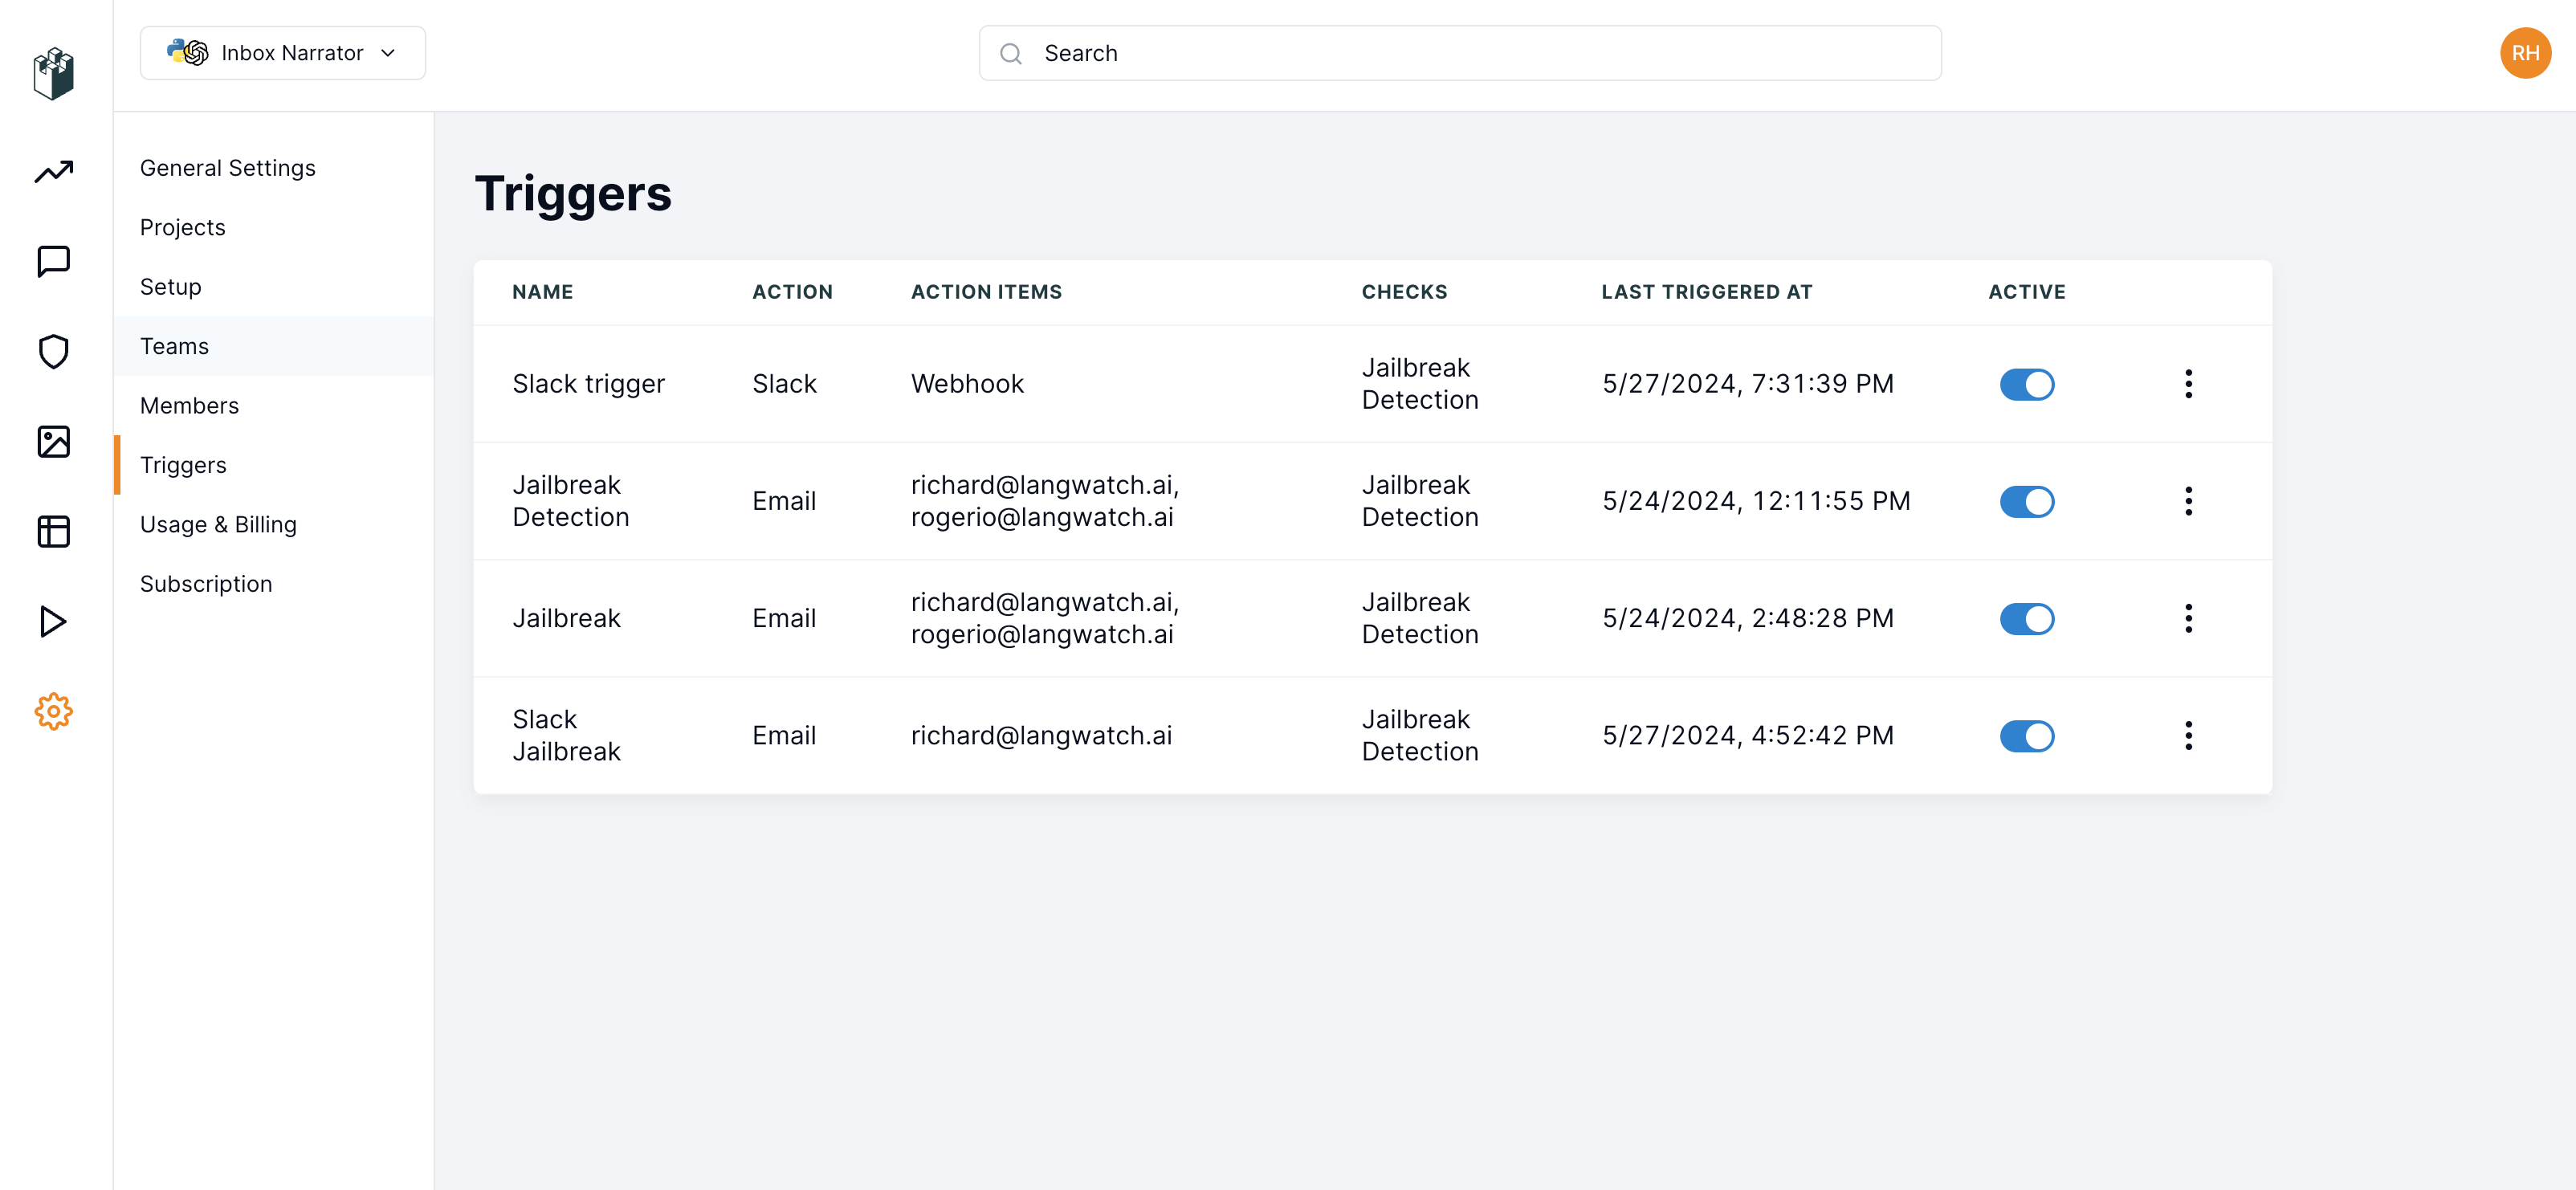
- Automations act on each trace that matches a filter: send an email, a Slack message or a webhook, add the trace to a dataset, or send it to an annotation queue.
- Alerts watch a series on a custom graph and fire when it crosses a threshold, for example p95 latency above 8 seconds.
- Reports send a dashboard, a single graph or a table of traces on a schedule, for example every Monday at 09:00.
Also check: Triggers API to manage automations over REST, the CLI or MCP, and Datasets from traces for the dataset column mapping.
Create an automation from a filter
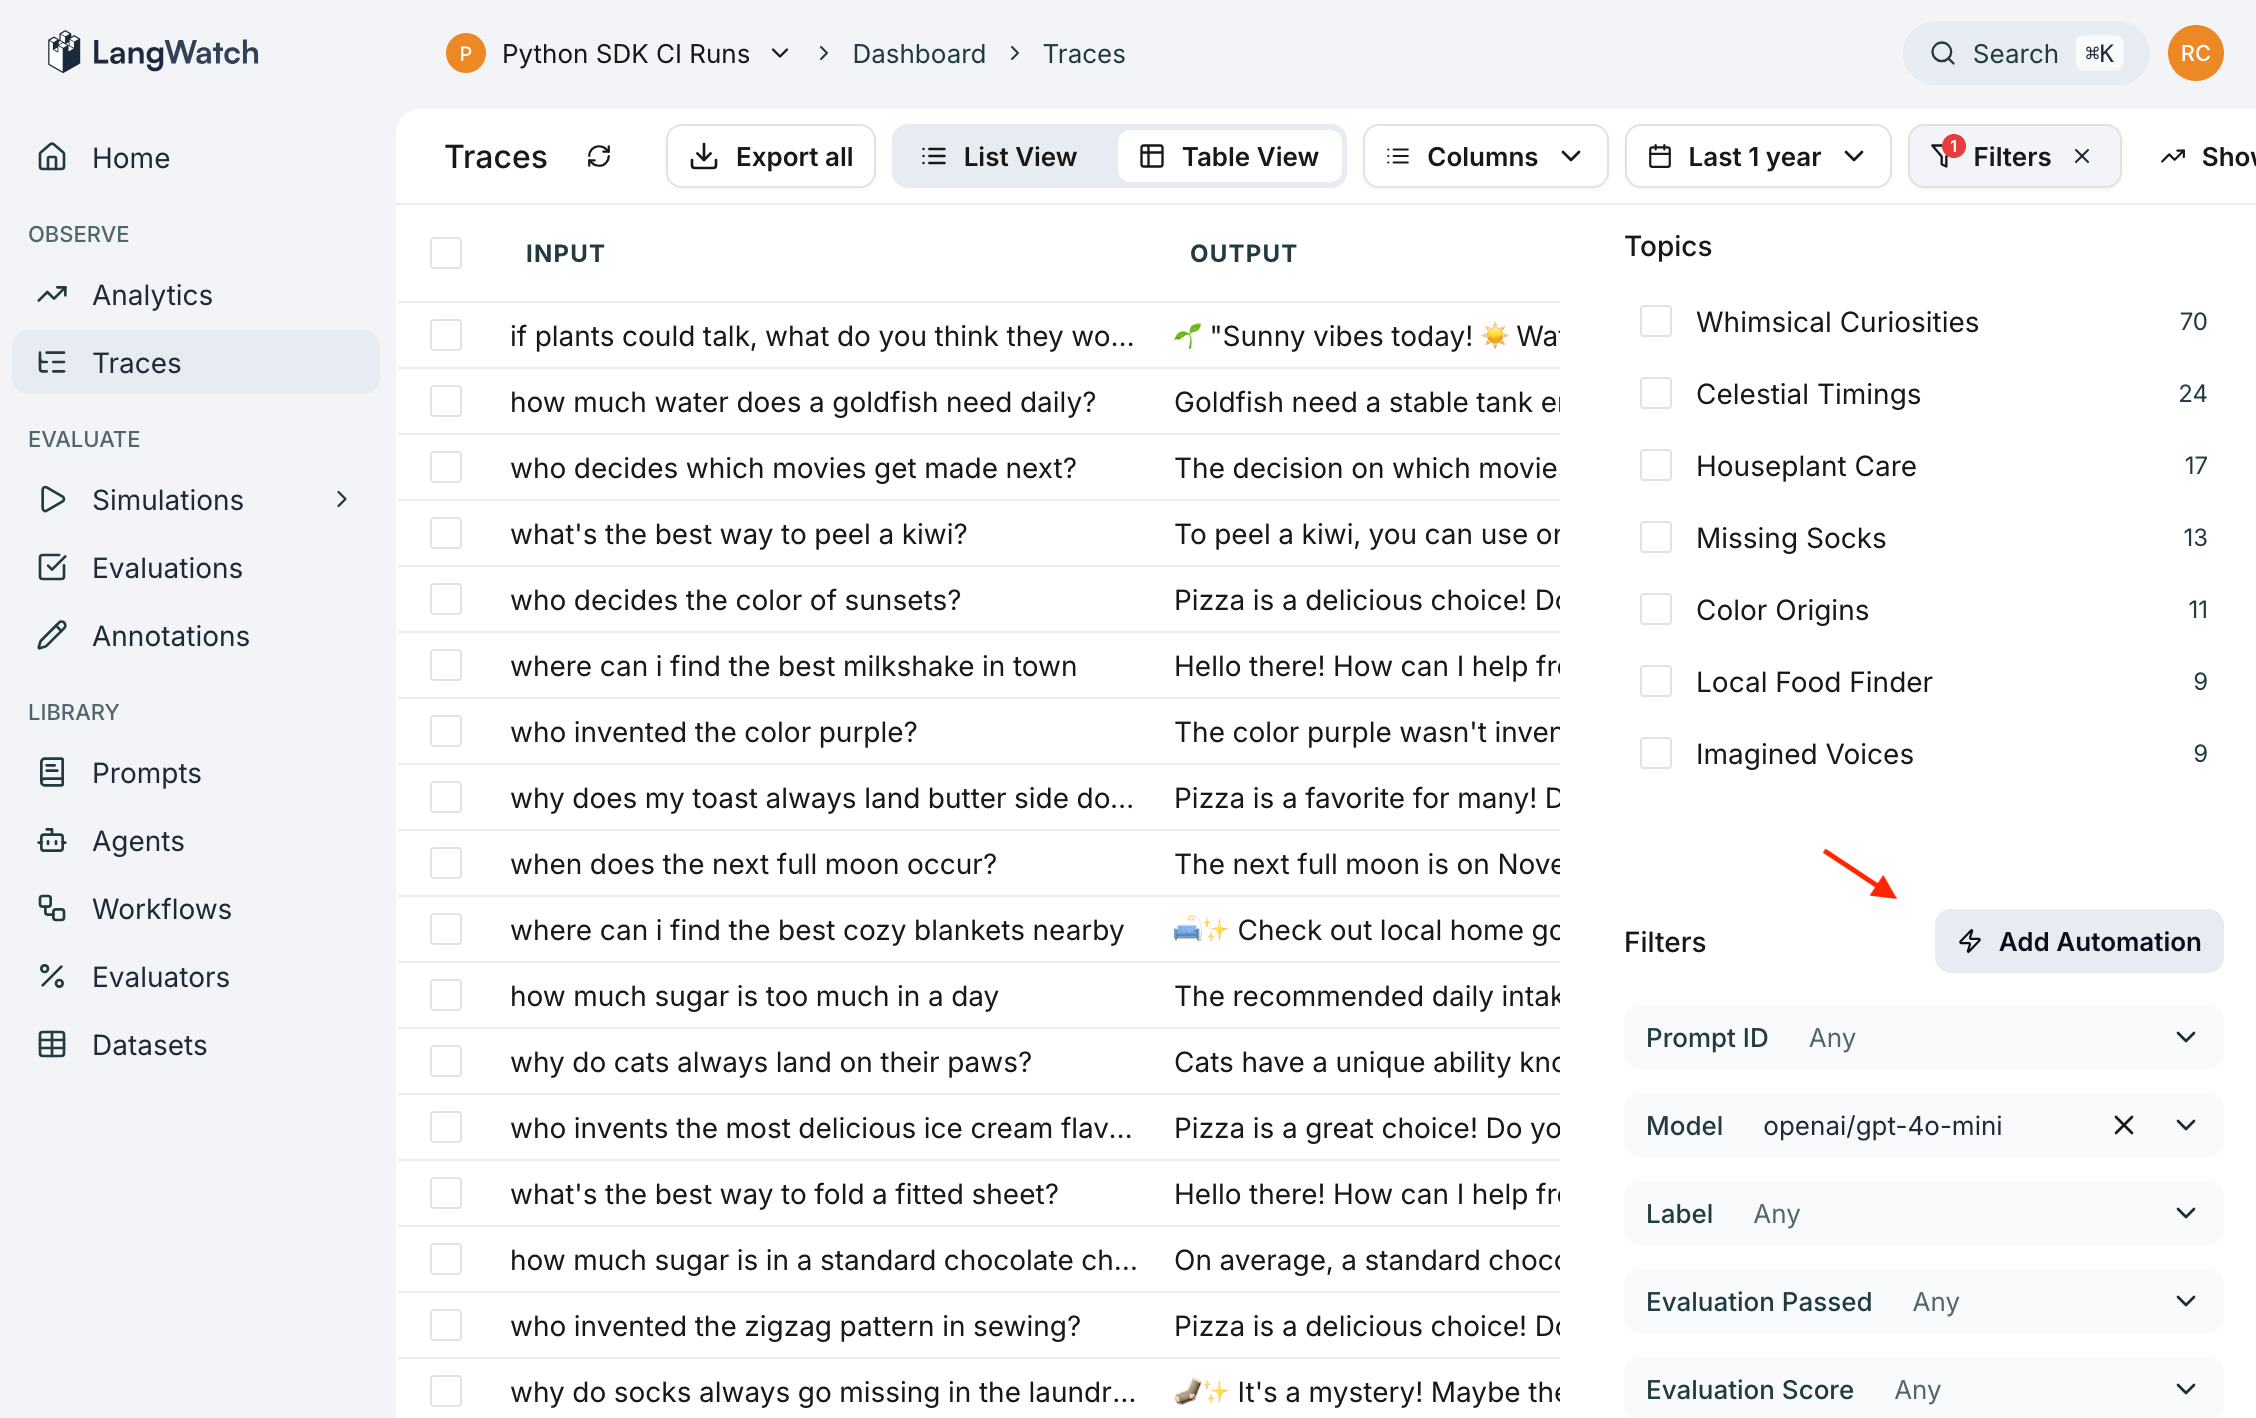
- Click the filter button located at the top right of the LangWatch dashboard.
- After creating a filter, an automation button will appear.
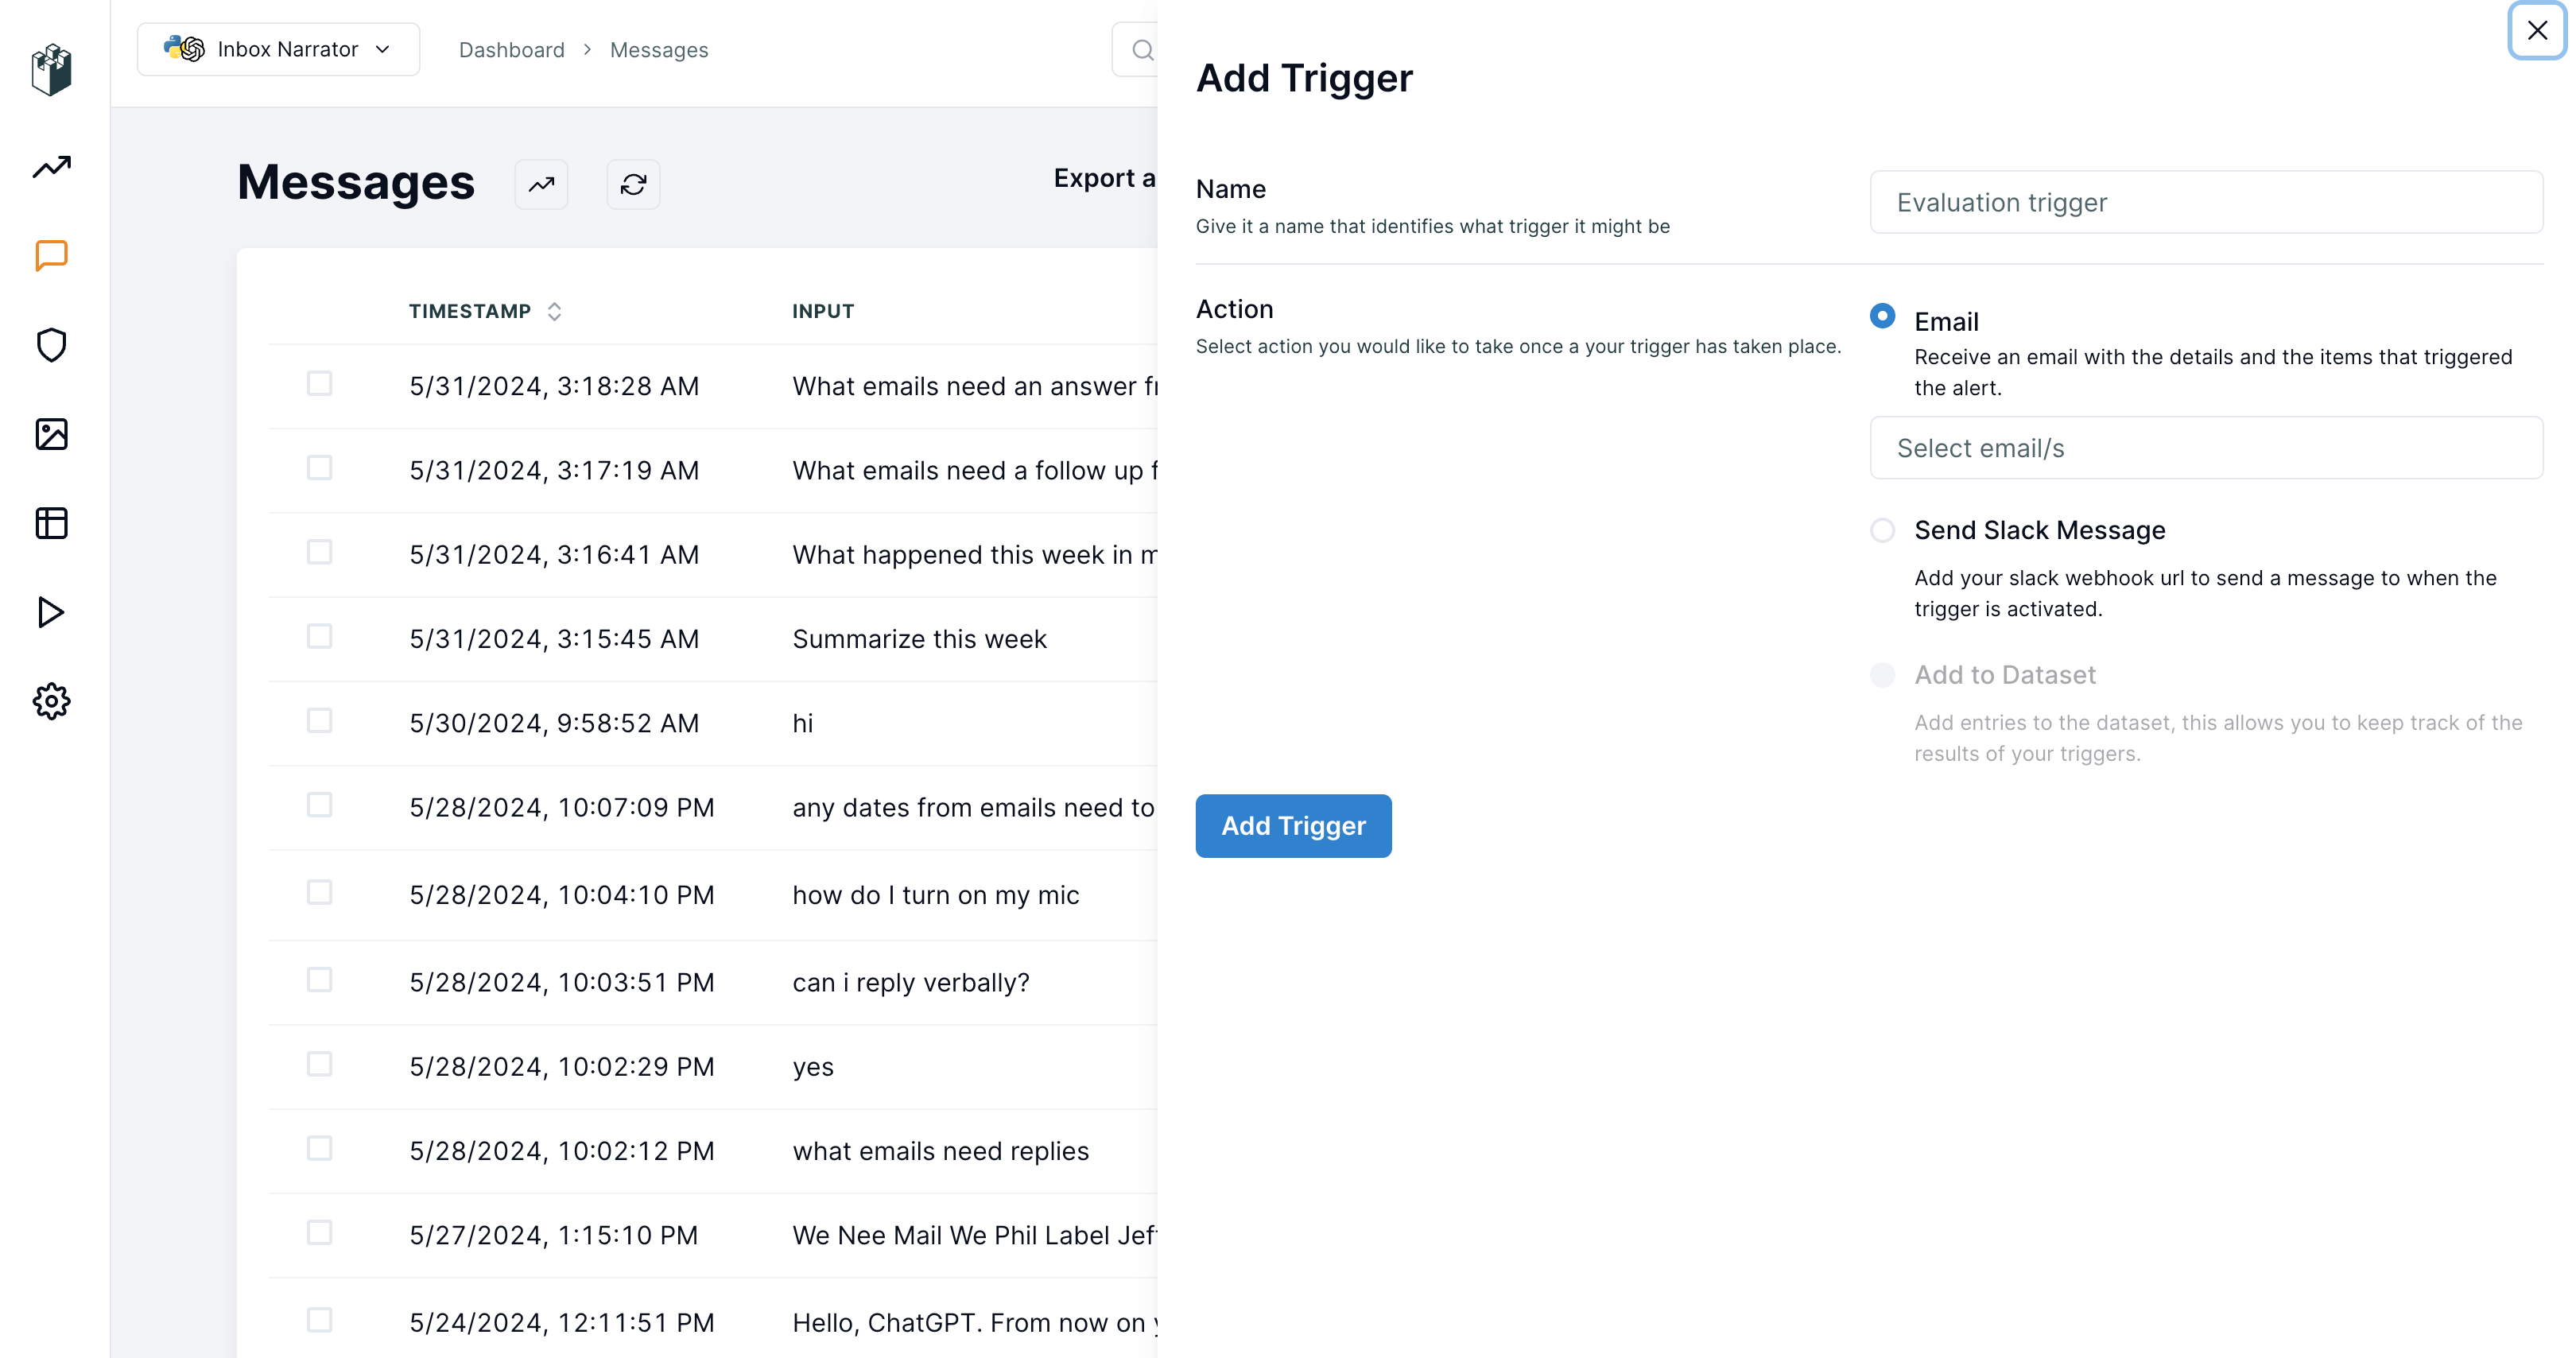
- Click the automation button to open a popout drawer.
- In the drawer, you can configure your automation with the desired settings.
Slack
A Slack automation posts through a Slack connection. Connections live under Settings → Integrations → Slack, where each one is listed with its name, kind, scope and how many automations use it. Add one with Add Slack connection, or with New Slack connection while setting up an automation’s Slack delivery; the new connection comes back selected. A connection is one of two kinds:- Bot: a Slack app bot token. Pick a channel for each automation, and the app posts there with every block of the message. Invite the app to the channel first.
- Incoming webhook: one webhook URL, which posts to the one channel Slack tied it to. Charts and tables are sent as text.
- Organization: every project in the organization can use it. Adding, editing or deleting one needs permission to manage the organization.
- Project: only that project can use it. Adding, editing or deleting one needs permission to update the project.
Automations used to carry their own webhook URL or bot token, and a project had one Slack integration. Each of those secrets is now a connection, and every automation points at the connection holding its secret: automations that shared a secret within one project share a project connection, and a secret shared across projects became an organization connection. You do not need to re-enter any secret.
Alerts and reports
An alert is set up on a custom graph: pick the series to watch, the comparison (above, below, equal), the threshold and the window (1 minute to 1 day). It fires when the series crosses the threshold and records when it recovers. A report renders a dashboard, one graph, or a table of the top traces for a filter, and sends it by email or Slack on a cron schedule in the timezone you choose. A report sends at most once every 15 minutes. Both can also be created withlangwatch trigger create --graph-alert and --report; see the Triggers API.
Pause, test and history
- Pause an automation to stop it acting without deleting it, and resume it later. A paused report stops sending.
- Test sends the automation’s message to its saved destination so you can check it arrives. A test is not recorded as a fire.
- History, in an automation’s details, lists every fire, newest first; Overview shows the recent fires across all of them. The same history is available with
GET /api/triggers/{id}/fires,langwatch trigger fires <id>and the MCP toolplatform_list_trigger_fires, each paged by cursor.