Connect my agent to LangWatch simulations

You are using LangWatch for your AI agent project. Follow these instructions.

IMPORTANT: You will need a LangWatch API key. Check whether LANGWATCH_API_KEY is already set: in the process environment, which is where CI injects it, and otherwise in the project's .env file. Use that key instead of asking for a new one. Read LANGWATCH_ENDPOINT from the same places, and nothing else out of .env: if the endpoint is set, the project is on a self-hosted instance, and the CLI works against that endpoint instead of app.langwatch.ai.
Use the `langwatch` CLI for everything: documentation (`langwatch docs ...`, `langwatch scenario-docs ...`) and platform operations (prompts, scenarios, evaluators, datasets, monitors, traces, analytics). Install it once with `npm install -g langwatch`, then run the `langwatch` binary directly; an unpinned `npx langwatch` re-resolves the package from the registry on every run.

# Connect Your Agent to LangWatch Simulations

Register the user's agent as an HTTP simulation target. Scenario runs call the agent's endpoint from the LangWatch backend, one HTTP request per conversation turn, and the judge verifies behavior against the traces the agent itself reports: tool calls, database writes, retrievals. Work through the steps in order, then report what changed and the first run's result.

Do NOT skip the trace adoption step (Step 4). Without it the judge can only grade the reply text, and criteria about tool calls or lookups come back inconclusive.

## Step 1: Set up the LangWatch CLI

Use `langwatch docs <path>` to read documentation as Markdown. Some useful entry points:

```bash
langwatch docs                                    # Docs index
langwatch docs integration/python/guide           # Python integration
langwatch docs integration/typescript/guide       # TypeScript integration
langwatch docs prompt-management/cli              # Prompts CLI
langwatch scenario-docs                           # Scenario docs index
```

Discover commands with `langwatch --help` and `langwatch <subcommand> --help`. List and get commands accept `--format json` for machine-readable output. Every list command takes `--limit <n>` to cap the rows and `--jq <expr>` to read part of the answer. A paginated list answers with an envelope, so count its rows through the row array (`--jq '.traces | length'`), and read how many there are in all at `.pagination.total`. Bare `--jq length` counts the fields of the envelope, not the rows. Read the docs first instead of guessing SDK APIs or CLI flags.

If no shell is available, fetch the same Markdown over plain HTTP. Append `.md` to any docs path (e.g. https://langwatch.ai/docs/integration/python/guide.md). Index: https://langwatch.ai/docs/llms.txt. Scenario index: https://langwatch.ai/scenario/llms.txt

If anything fails or confuses you while following this skill (broken commands, docs that do not match reality, errors you had to work around), ask the user for permission and run `npx --yes langwatch report --user-approved` with a `--title` and `--summary` (or `--session <transcript.jsonl>`) to send it to the LangWatch team, and it directly shapes what gets fixed. No login or API key needed. Nothing is sent without `--user-approved`, and `--dry-run` prints the exact payload without sending anything. The title, summary and transcript are scrubbed locally first, by pattern: secrets and API keys, plus email addresses, phone numbers, card numbers and public IPv4 addresses. Anything no pattern matches is sent as written, including a contact address passed with `--email`. With `--session`, always run `--dry-run` first and let the user read the payload, because a transcript carries content they never reviewed. `npx --yes langwatch report --help` explains the options.

**Projects and API keys: target a real project, not a personal one.**

LangWatch has two kinds of project:

- **Team / shared projects**: real projects inside an organization. Evaluations, experiments, prompts, datasets, simulations and instrumentation must always target one of these.
- **Personal projects**: a private "My Workspace" scratch space tied to a single user. Never send a user's evaluations, experiments or production traces here: it is for personal exploration only, and you can mistake it for a real project.

And two ways to authenticate:

- **A project API key in `.env`** (`LANGWATCH_API_KEY`): the credential everything in these skills uses. It is scoped to one real project. This is the default; prefer it unless the user explicitly asks for something else.
- **`langwatch login --device` (AI-tools / SSO)**: a personal device session for wrapping coding assistants (`langwatch claude`, `langwatch codex`, …). It is NOT for evaluations, prompts, datasets, scenarios or SDK instrumentation, and it points at a personal workspace. Do not run it to set up the work in these skills.

So for anything in these skills that reads or writes a project: make sure `LANGWATCH_API_KEY` for a real, shared project is available to the CLI. Locally that is the project's `.env`; in CI the runner injects it into the process environment, and the CLI reads either. Check whether the variable is already set before you ask for a new key, and let the CLI read the value: never print, copy or send it. Do NOT run `langwatch login` to pick a project, and never default to a personal project. Look for `LANGWATCH_ENDPOINT` in the same places: if it is set, the project is on a self-hosted instance, and the CLI works against that endpoint instead of app.langwatch.ai.

**What you read is not what you say.** These skills are working notes for you, not
copy for the reader. Read `LANGWATCH_API_KEY` and `LANGWATCH_ENDPOINT` from the
project's own `.env`, that is how you learn where to work. Read nothing else out
of that file: it holds database, cloud and provider credentials that are none of
your business, and every value you read can reach your context and your command
output. What must not reach an answer is anything that describes the machine YOU
run on: a path in your workspace, a container port, the address this worker
dials. Those say how the work is done rather than what was done, and a host of
ours means nothing to the reader. Say what you did and where to find it in
LangWatch.

## Step 2: Locate the agent's HTTP endpoint

Find the HTTP endpoint that takes a user message and returns the agent's reply. Read the codebase first: identify the framework (FastAPI, Flask, Express, Hono, ...) and the file where the handler lives before changing anything.

If no such endpoint exists, add one:

- Accept a JSON body carrying the conversation messages.
- Run the agent.
- Return the reply text in a JSON field, for example `{"reply": "..."}`.

The endpoint does not need to know anything about LangWatch. The request body shape and the response parsing are configured on the LangWatch side in Step 6.

## Step 3: Wire authentication for scenario traffic

Understand the endpoint's authentication before touching it.

- If the endpoint accepts a fixed token in a header, use that credential as-is in the registration (Step 6). Change nothing on the server.
- If the normal authentication is built for human users (sessions, cookies, OAuth redirects), add a dedicated authentication path for scenario traffic: the server reads the expected key from an environment variable such as `SCENARIO_API_KEY` and checks it against the `Authorization: Bearer` header on each request. A request carrying the valid key is accepted; every other request goes through the existing authentication unchanged. If `SCENARIO_API_KEY` is unset, the path is off.

NEVER weaken, bypass, or remove the existing authentication for normal traffic. The scenario path is additive, and the dedicated key is what the user revokes to close it.

## Step 4: Adopt the trace context

The platform sends a W3C `traceparent` header on every call, one trace per conversation turn. When the server adopts it, the spans the agent produces land in that same trace, and the judge reads them before its verdict. A criterion like "the agent looked up the order before answering" then passes on evidence instead of on the reply's wording.

- If the service uses OpenTelemetry HTTP auto-instrumentation, adoption already happens. Verify it in the code and change nothing.
- Otherwise, attach the extracted context in a middleware that runs before any tracing starts. Do not extract inside the handler body: a handler decorated with `@langwatch.trace()` opens its root span before the body runs, so an extraction there is too late and the agent's spans land in a separate trace. The middleware placement covers every tracing style: decorators, `with langwatch.trace()`, autotrack, community instrumentations, and plain OpenTelemetry spans.

**Python (ASGI middleware, e.g. FastAPI):**

```python
from opentelemetry import propagate
from opentelemetry.context import attach, detach

@app.middleware("http")
async def adopt_remote_trace(request, call_next):
    token = attach(propagate.extract(dict(request.headers)))
    try:
        return await call_next(request)
    finally:
        detach(token)
```

For Flask, attach in `before_request` (keep the token on `g`) and detach in `teardown_request`.

**TypeScript (middleware, registered before the routes):**

```typescript
import { context, propagation } from "@opentelemetry/api";

app.use((req, res, next) => {
  const ctx = propagation.extract(context.active(), req.headers);
  context.with(ctx, () => next());
});
```

The TypeScript middleware needs an initialized OpenTelemetry runtime: a registered context manager and propagator. The LangWatch SDK's `setupObservability()` and the OpenTelemetry `NodeSDK` both register them at startup; without one of them, `context.with` and `propagation.extract` are no-ops.

Confirm the agent reports its traces to the same LangWatch project that runs the scenarios (the same `LANGWATCH_API_KEY` project). Traces sent to another project, or to another observability backend only, are invisible to the judge. If the service has no LangWatch tracing yet, set it up with the `tracing` skill; its prompt is "Instrument my code with LangWatch".

## Step 5: ASK where the agent runs

Ask the user for the URL where this service is deployed, and wait for the answer. A staging deployment is the recommended target: it exercises the real system without touching production data. Any URL the LangWatch backend can reach works; an internal hostname or a firewalled service does not.

If the agent only runs on the user's machine, plan to use `langwatch agent dev --port <port>` at the end instead of a public URL: it opens a tunnel to the local port and points the registered agent at it for the session (Ctrl-C restores the previous URL). Register the agent in Step 6 as normal, then run `langwatch agent dev --port <port> --agent <agent-id>` and keep it running while test suites execute.

## Step 6: Register the agent and run the first scenario

First store the scenario key as a project secret, so the registration can reference it as `{{ secrets.SCENARIO_API_KEY }}` and the value stays encrypted at rest instead of readable in the agent's configuration. Ask the user to create it under Settings > Secrets in LangWatch, or run the command when they hand you a test-only value:

```bash
langwatch secret create SCENARIO_API_KEY --value "<key>"
```

Register the endpoint as an HTTP agent. Adjust `bodyTemplate` to the request shape the endpoint expects and `outputPath` to the JSONPath of the reply text in the endpoint's real response:

```bash
langwatch agent create 'My Agent' --type http --config '{
  "url": "https://staging.example.com/chat",
  "bodyTemplate": "{\"thread_id\": \"{{ threadId }}\", \"messages\": {{ messages }}}",
  "outputPath": "$.reply",
  "auth": {"type": "bearer", "token": "{{ secrets.SCENARIO_API_KEY }}"}
}'
```

The body template renders as a Liquid template on every turn. The URL and header values render the same variables:

| Variable | Value |
|---|---|
| `{{ messages }}` | The whole conversation as a raw JSON array of `{role, content}` messages |
| `{{ input }}` | The text of the last user message |
| `{{ threadId }}` | A conversation id, the same on every turn of a run |
| `{{ params.NAME }}` | A run parameter the scenario declares |
| `{{ traceId }}`, `{{ traceparent }}` | The turn's trace identifiers, for systems that read them from the body or a custom header instead of the `traceparent` header |

Then create a test suite, create one scenario about something this agent really handles, file it into the test suite, and run the test suite against the agent:

```bash
langwatch test-suite create 'Smoke'

langwatch scenario create 'Order status question' \
  --situation "A customer asks about the status of a recent order" \
  --criteria "The agent looks up the order before answering,The agent gives a concrete delivery estimate" \
  --test-suite 'Smoke'

langwatch test-suite run 'Smoke' --target http:<agent-id> --wait
```

- Write the situation and criteria from the agent's real behavior in this codebase, not from the example above. Include at least one criterion about a tool call or a lookup, which the judge verifies against the traces from Step 4.
- `--criteria` takes one comma-separated string, so a criterion cannot contain a comma; rephrase instead.
- `--test-suite` files the scenario into a test suite that already exists, by name or by id. Create the test suite first.
- `--target` takes `http:<agent-id>` where `<agent-id>` is the id `langwatch agent create` returned (also in `langwatch agent list --format json`). It is never a URL; the URL lives in the agent's config. Repeat `--target` for a second agent or prompt.
- The run goes under the run plan named after the test suite and the target. A later run of the same pair joins the same history, so the pass rate over time is readable in **Agent Testing > Results**.
- `--wait` blocks until the run finishes and exits non-zero when it fails. Use it here: the report in Step 7 needs the result.

## Step 7: Report the result

Report to the user:

- The Agent Testing page URL of their LangWatch project (`https://app.langwatch.ai/<project-slug>/agent-testing`, or the same path on their own instance when self-hosted).
- What changed in the codebase: the endpoint, the authentication path, the trace adoption.
- The result of the first run.

Report failures as they happened. If a CLI command failed or the platform was unreachable, name the step that failed and what the failure means for the user, and stop there. Do not paste the raw error text, stack trace or debug URL: those can carry secrets and tell the user nothing they can act on. Do NOT claim a scenario or a test suite ran when it did not.

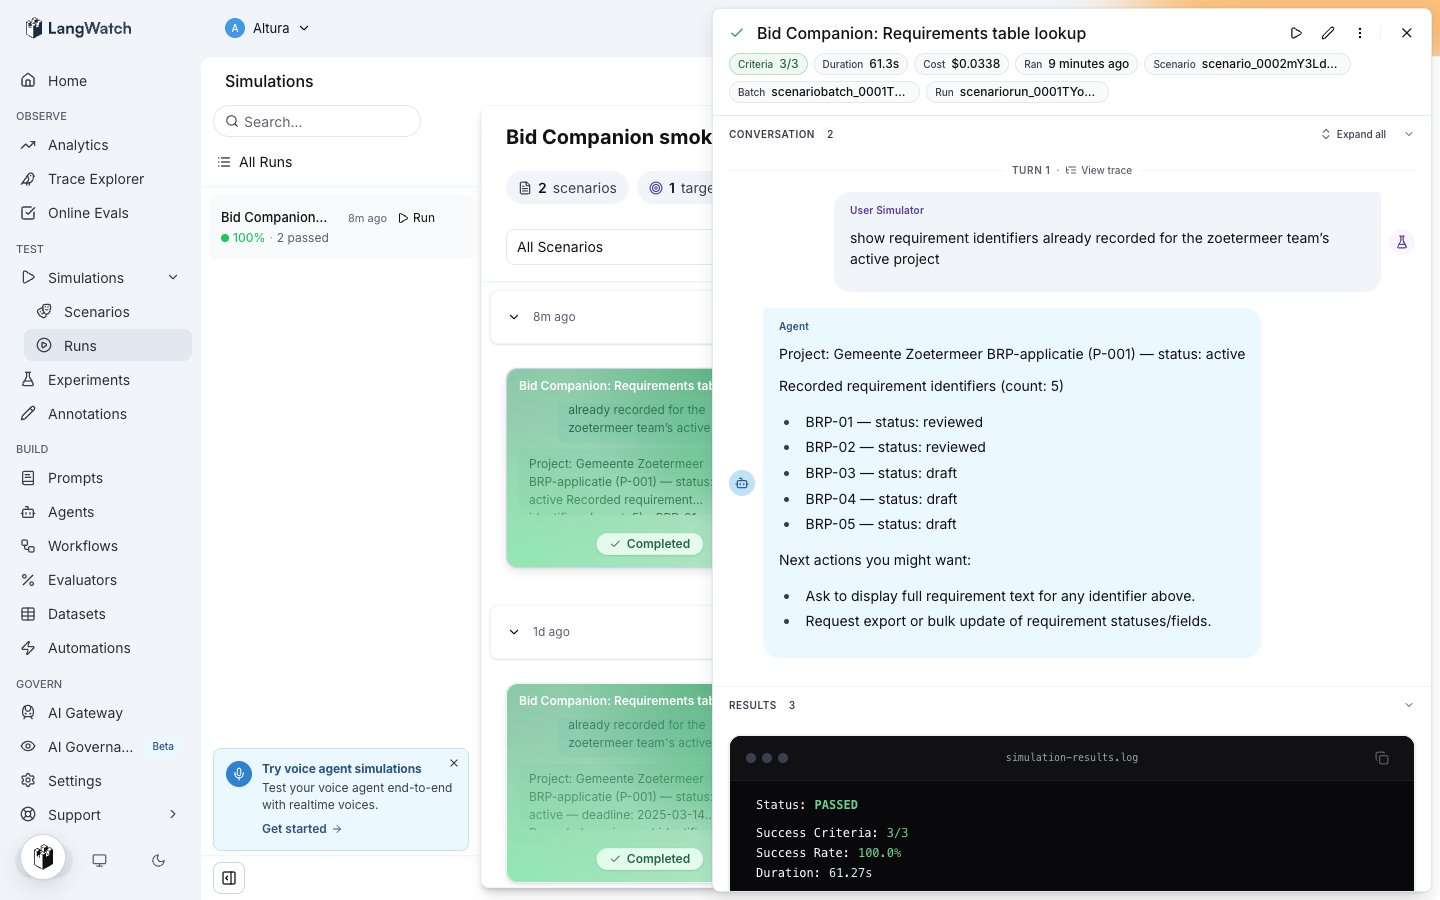
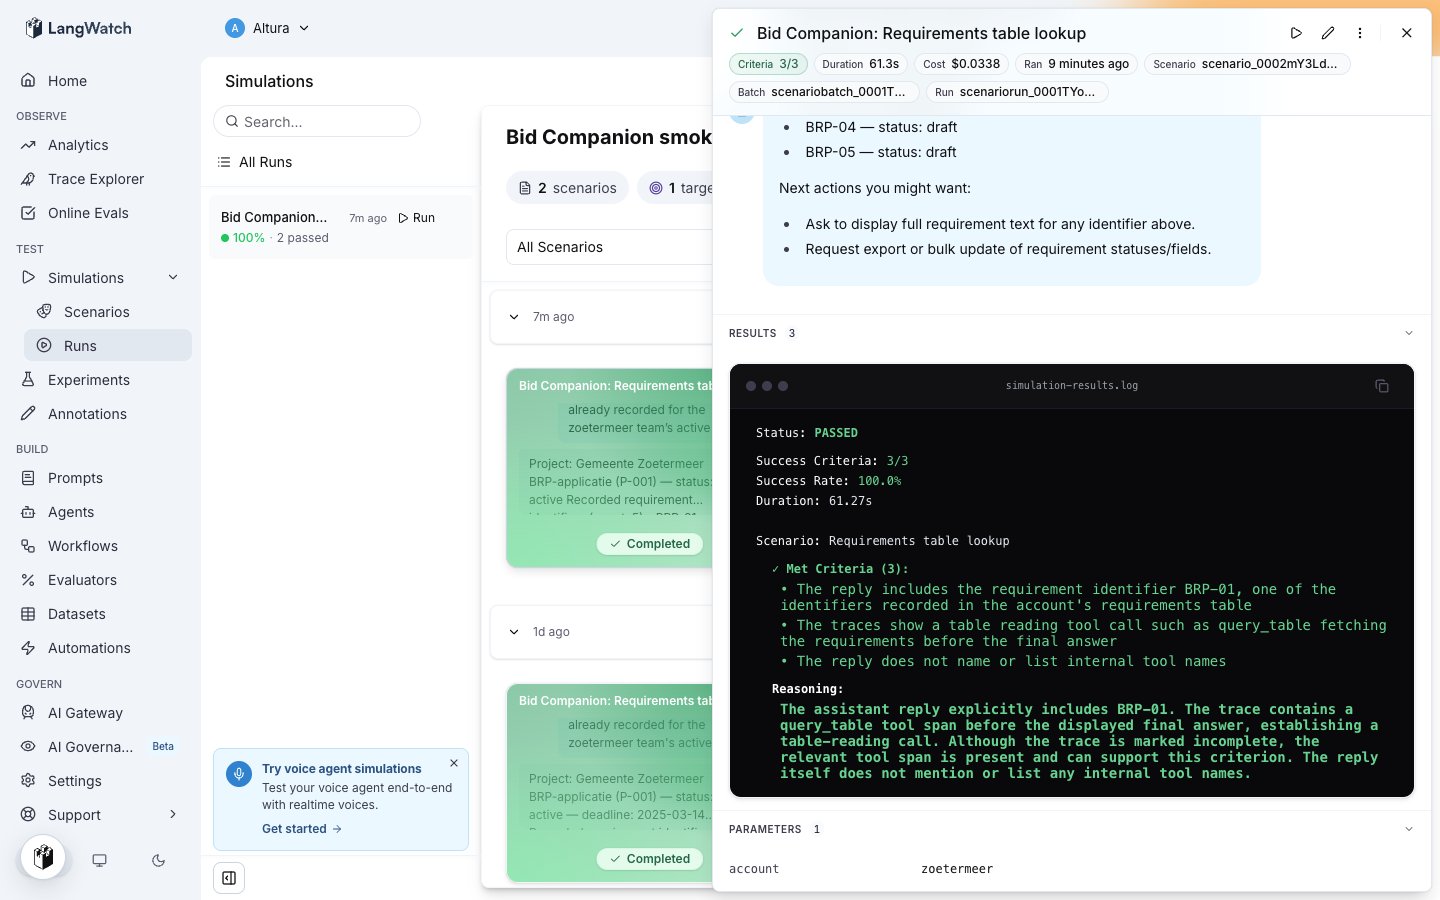
A connected setup shows, on the run page: the conversation transcript with the reply text `outputPath` extracted, a trace link on each turn opening the agent's own spans, and judge reasoning that cites spans. A trace-dependent criterion that comes back inconclusive means the traces did not arrive.

## Plan Limits

LangWatch's free plan has limits on prompts, scenarios, evaluators, experiments, and datasets. When you hit a limit, the API returns `"Free plan limit of N reached..."` with an upgrade link.

How to handle:

- Work within the limits. If 3 resources of the relevant type are allowed, create 3 meaningful ones, not 10.
- Make every creation count: each one should demonstrate clear value.
- Show what works FIRST. If you hit a limit, summarize what was accomplished and note that upgrading the plan raises it. Point to the subscription settings on the platform, or to the license settings if the CLI is pointed at a self-hosted endpoint. Read the endpoint the CLI actually uses, which can come from `.env`, from the process environment, or from the saved CLI configuration.
- Do NOT delete existing resources to make room or repurpose an existing resource to evade the limit.

## Common Failures

| Symptom | Cause | Fix |
|---|---|---|
| The run fails with a connection error | The URL is not reachable from the LangWatch backend: an internal hostname, a firewall, or a stopped service. | Deploy the endpoint to a reachable URL, or use `langwatch agent dev --port <port>` for a local process. |
| Every turn fails with 401 or 403 | The credential is missing or wrong: no `auth` block or header row, or the `{{ secrets.NAME }}` reference names a secret the project does not have. | Add the `auth` block, and check the secret's name with `langwatch secret list`. |
| The transcript shows empty replies or raw JSON | `outputPath` does not match the response shape, so no reply text is found. | Set `outputPath` to the JSONPath of the reply text in the endpoint's real response. |
| Trace-dependent criteria come back inconclusive, and turns have no trace link | The server does not adopt the incoming `traceparent`, or it reports traces to a different LangWatch project. | Adopt the context as in Step 4, and point the agent's tracing at the same project's API key. |

## Common Mistakes

- Do NOT weaken or remove the endpoint's existing authentication. The dedicated scenario key is an additional path, checked only when the request carries it.
- Do NOT put the raw key in the agent config. Store it with `langwatch secret create` and reference `{{ secrets.SCENARIO_API_KEY }}`.
- Do NOT skip trace adoption because the endpoint "already returns the answer". The reply text cannot prove a tool call happened; the trace can.
- Do NOT append a list of tools used to the response text so the judge can "see" them. That grades a self-report instead of evidence; adopt `traceparent` and the trace carries the real calls.
- Do NOT point the agent's tracing at a different LangWatch project than the one running the scenarios. The judge finds nothing there.
- Do NOT invent an agent id or pass a URL as the run target. `http:` is followed by the Agent id from `langwatch agent create` or `langwatch agent list --format json`.
- Do NOT pass `--test-suite` a test suite the project does not hold. The command refuses it; create the test suite first with `langwatch test-suite create`.
- Do NOT guess the deployment URL or quietly default to localhost. Step 5 is a question for the user; ask and wait.
- Do NOT report success when a command failed. An unreachable platform or a failed run is part of the report, named per step.