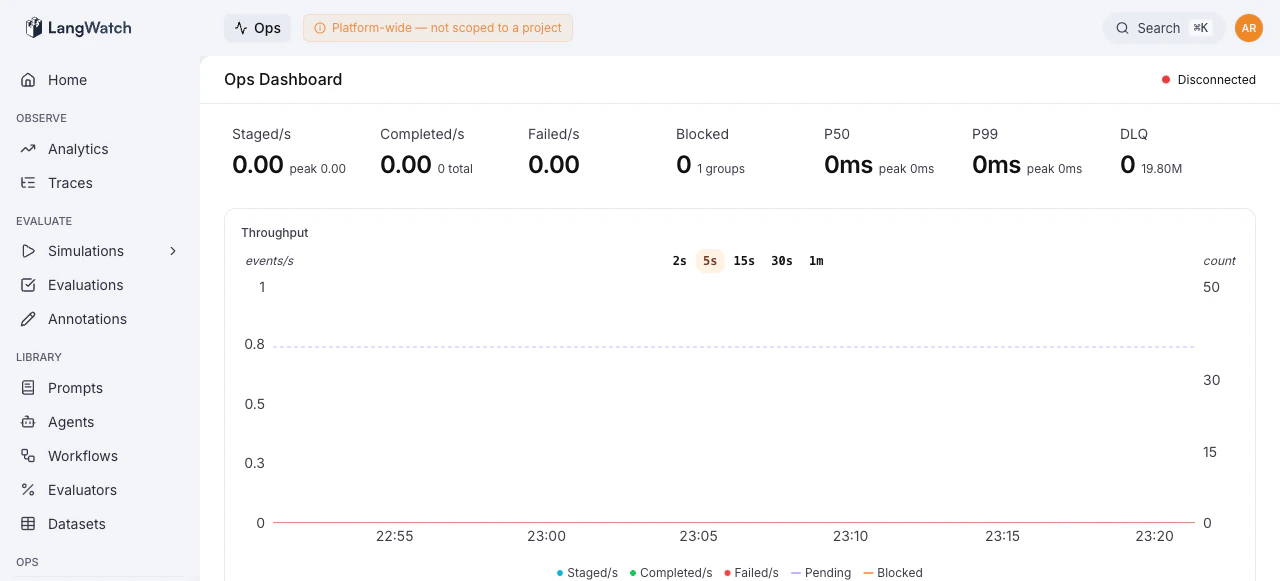
The Ops Dashboard is the landing page of the Operations Console (/ops). It provides a real-time view of the event-sourcing pipeline, ingestion rates, processing throughput, latency percentiles, queue health, and top errors, all in a single screen.
Metrics Overview
The top of the dashboard displays six key metrics, each showing the current rate and a secondary stat (peak, total, or count):
Metrics marked in red indicate an active problem, non-zero failure rates or blocked groups. Orange
indicates a warning state, such as items in the DLQ.
Active Operations
When a projection replay is running or pipelines are paused, a banner appears below the metrics showing:
- Replay status with the current projection name and a link to the detailed progress view
- Paused pipelines listed as orange badges
Throughput Chart
A time-series chart tracks throughput over time, showing staged, completed, and failed rates. Use this to identify processing backlogs (staged >> completed) or failure spikes.
Pipeline Tree
The pipeline tree shows the hierarchical structure of all processing pipelines. Each node represents a pipeline stage.
Operators with ops:manage permission can pause and unpause individual pipeline stages directly from the tree. Pausing a stage prevents new jobs from being consumed while allowing in-flight jobs to complete.
Top Errors
The bottom of the dashboard lists the top error patterns across all queues, showing:
- Count: how many jobs hit this error
- Error message: normalized and deduplicated
- Pipeline: which pipeline stage produced the error
This gives a quick signal on whether errors are concentrated in a single pipeline or scattered across the system.
Real-Time Updates
The dashboard uses Server-Sent Events (SSE) for real-time metric streaming. A connection status indicator in the header shows:
- Connected (green), live SSE connection active
- Polling (yellow), SSE unavailable, falling back to 5-second polling
- Disconnected (red), no connection
Both modes deliver the same data; SSE provides lower-latency updates.
Replay History
A compact section at the bottom shows the latest projection replay run with its status, duration, and description. Click it to navigate to the full replay detail view. Last modified on October 12, 2026