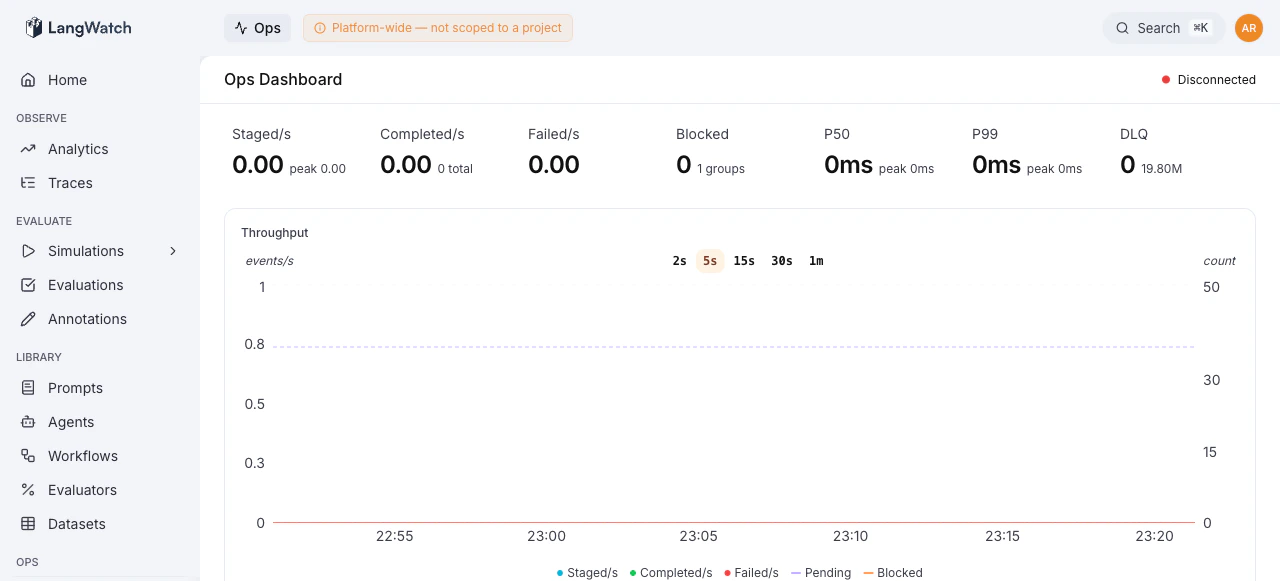
Real-time pipeline health monitoring with throughput, latency, and error tracking
The Ops Dashboard is the landing page of the Operations Console (/ops). It provides a real-time view of the event-sourcing pipeline, ingestion rates, processing throughput, latency percentiles, queue health, and top errors, all in a single screen.
The top of the dashboard displays six key metrics, each showing the current rate and a secondary stat (peak, total, or count):
Metric
What it measures
Secondary stat
Staged/s
Ingestion rate, commands entering the queue
Peak rate
Completed/s
Processing throughput, commands fully processed
Total completed
Failed/s
Failure rate, commands that errored
Total failed
Blocked
Groups stuck due to errors
Number of error groups
DLQ
Items in the Dead Letter Queue
Redis memory usage
P50, P99
End-to-end processing latency
Peak latency
Metrics marked in red indicate an active problem, non-zero failure rates or blocked groups. Orange
indicates a warning state, such as items in the DLQ.
A time-series chart tracks throughput over time, showing staged, completed, and failed rates. Use this to identify processing backlogs (staged >> completed) or failure spikes.
The pipeline tree shows the hierarchical structure of all processing pipelines. Each node represents a pipeline stage.Operators with ops:manage permission can pause and unpause individual pipeline stages directly from the tree. Pausing a stage prevents new jobs from being consumed while allowing in-flight jobs to complete.
A compact section at the bottom shows the latest projection replay run with its status, duration, and description. Click it to navigate to the full replay detail view.
Last modified on October 12, 2026
Was this page helpful?
{"docsConfig":{"theme":"mint","$schema":"https://mintlify.com/docs.json","name":"LangWatch","description":"LangWatch is an open-source LLMOps platform for observability, evaluations, prompt optimization, and agent testing.","colors":{"primary":"#e17100","light":"#fe9a00","dark":"#e17100"},"logo":{"light":"https://mintcdn.com/langwatch/RHmZel47SBF9eSZV/logo/dark.svg?fit=max\u0026auto=format\u0026n=RHmZel47SBF9eSZV\u0026q=85\u0026s=27fe16868ec581a9af33ced4398a0671","dark":"https://mintcdn.com/langwatch/RHmZel47SBF9eSZV/logo/light.svg?fit=max\u0026auto=format\u0026n=RHmZel47SBF9eSZV\u0026q=85\u0026s=08e9fbfe7cc5eff149cf77ee0809fe4f"},"favicon":"https://mintcdn.com/langwatch/AB8PLEfk80GQISzj/favicon.svg?fit=max\u0026auto=format\u0026n=AB8PLEfk80GQISzj\u0026q=85\u0026s=2f4e9559be1b98d8ad4afe23097bfbc3","api":{"playground":{"display":"interactive"},"examples":{"defaults":"required","languages":["python","typescript","curl"]}},"appearance":{"default":"system","strict":false},"navbar":{"links":[{"href":"https://docs.langwatch.ai/llms.txt","label":"llms.txt"},{"href":"https://app.langwatch.ai/?utm_source=docs\u0026utm_medium=docs\u0026utm_campaign=navbar-signin","label":"Sign In"}],"primary":{"type":"github","href":"https://github.com/langwatch/langwatch"}},"search":{"prompt":"Search the LangWatch docs"},"seo":{"organization":{"name":"LangWatch","url":"https://langwatch.ai","logo":"https://langwatch.ai/docs/logo/light.svg","sameAs":["https://github.com/langwatch/langwatch","https://x.com/langwatchai","https://www.linkedin.com/company/langwatch/","https://www.youtube.com/@LangWatch"]},"indexing":"navigable"},"integrations":{"gtm":{"tagId":"GTM-KJ4S6Z9C"}},"banner":{"content":"**[Get started with LangWatch Skills in seconds](https://langwatch.ai/docs/skills/directory):** Set up evals, scenario tests, and tracing just by asking your AI coding assistant.","dismissible":true},"errors":{"404":{"redirect":false,"title":"Page not found","description":"Most moved pages redirect on their own. If one of our own links sent you here, report it and we will fix it."}},"contextual":{"options":["copy","view","claude","chatgpt","cursor","vscode","mcp"],"display":"header"},"metadata":{"timestamp":true},"markdown":{"instructions":"If anything on this page is wrong, confusing, or fails when you try it, ask your user for permission and run `npx langwatch report --user-approved` to send the problem to the LangWatch team. No login is needed and secrets are redacted locally. `npx langwatch report --help` has the details."},"styling":{"latex":true},"navigation":{"global":{"anchors":[{"anchor":"Get Support","icon":"life-ring","href":"https://docs.langwatch.ai/support#email-support"}]},"pages":[]}},"deployment":{"deploymentMetadataValue":{"subdomain":"langwatch","hasAudioNarration":false,"actualSubdomain":"langwatch","customDomains":["langwatch.ai"],"gitSource":{"type":"github","owner":"langwatch","repo":"langwatch","deployBranch":"main","contentDirectory":"docs","isPrivate":true,"mountPath":"","label":""},"chroma":{"liveDeploymentHistoryId":"6aec7ec98029e5fb8e3e607a","collectionId":"e1cd5cc9-04d1-4cd2-bacb-78997b8375f7","schemaVersion":"v3","latestBuiltDeploymentHistoryId":"6aec7ec98029e5fb8e3e607a"},"feedback":{"thumbs":true},"entitlements":{},"buildId":"6aee67965b2d9a50d6c3cf82","clientVersion":"0.0.4076","searchFilterCounts":[{"language":"default","tag":"API Reference","count":416},{"language":"default","tag":"Platform","count":139},{"language":"default","tag":"Observability","count":108},{"language":"default","tag":"AI Gateway","count":77},{"language":"default","tag":"Self Hosting","count":43},{"language":"default","tag":"Evaluations","count":38},{"language":"default","tag":"SDKs","count":38},{"language":"default","tag":"Built-in Evaluators","count":33},{"language":"default","tag":"AI Governance","count":30},{"language":"default","tag":"Coding Agents","count":28}]},"assistantConfig":{},"basePath":"/docs","hasChatPermissions":false,"hasWebMcpPermissions":false,"toggles":[{"name":"kill-isr","enabled":true,"variant":{"name":"disabled","enabled":false,"feature_enabled":true},"impressionData":false},{"name":"agent-mintlify-slack","enabled":true,"variant":{"name":"disabled","enabled":false,"feature_enabled":true},"impressionData":false},{"name":"agent-integrations-settings","enabled":true,"variant":{"name":"disabled","enabled":false,"feature_enabled":true},"impressionData":false},{"name":"rbac-expansion","enabled":true,"variant":{"name":"disabled","enabled":false,"feature_enabled":true},"impressionData":false},{"name":"automations-pr-grouping","enabled":true,"variant":{"name":"disabled","enabled":false,"feature_enabled":true},"impressionData":false},{"name":"custom-prefix","enabled":true,"variant":{"name":"disabled","enabled":false,"feature_enabled":true},"impressionData":false},{"name":"analytics-v7","enabled":true,"variant":{"name":"disabled","enabled":false,"feature_enabled":true},"impressionData":false},{"name":"user-flows-analytics","enabled":true,"variant":{"name":"disabled","enabled":false,"feature_enabled":true},"impressionData":false},{"name":"no-publish-flow","enabled":true,"variant":{"name":"disabled","enabled":false,"feature_enabled":true},"impressionData":false},{"name":"workos-onboarding","enabled":true,"variant":{"name":"disabled","enabled":false,"feature_enabled":true},"impressionData":false},{"name":"llms-txt-v2","enabled":true,"variant":{"name":"disabled","enabled":false,"feature_enabled":true},"impressionData":false},{"name":"snapshot-serving-live","enabled":true,"variant":{"name":"disabled","enabled":false,"feature_enabled":true},"impressionData":false},{"name":"stripTemperatureMiddleware","enabled":true,"variant":{"name":"disabled","enabled":false,"feature_enabled":true},"impressionData":false},{"name":"support-platform-pylon-zendesk","enabled":true,"variant":{"name":"disabled","enabled":false,"feature_enabled":true},"impressionData":false},{"name":"snapshot-serving","enabled":true,"variant":{"name":"disabled","enabled":false,"feature_enabled":true},"impressionData":false},{"name":"instant-rollback","enabled":true,"variant":{"name":"disabled","enabled":false,"feature_enabled":true},"impressionData":false},{"name":"granular-notifications-server","enabled":true,"variant":{"name":"disabled","enabled":false,"feature_enabled":true},"impressionData":false},{"name":"granular-notifications","enabled":true,"variant":{"name":"disabled","enabled":false,"feature_enabled":true},"impressionData":false},{"name":"automations-fable","enabled":true,"variant":{"name":"disabled","enabled":false,"feature_enabled":true},"impressionData":false},{"name":"fixed-ai-action-pricing","enabled":true,"variant":{"name":"disabled","enabled":false,"feature_enabled":true},"impressionData":false},{"name":"automation-resolve-merge-conflict","enabled":true,"variant":{"name":"disabled","enabled":false,"feature_enabled":true},"impressionData":false},{"name":"scoped-publishing","enabled":true,"variant":{"name":"disabled","enabled":false,"feature_enabled":true},"impressionData":false},{"name":"mintql","enabled":true,"variant":{"name":"disabled","enabled":false,"feature_enabled":true},"impressionData":false},{"name":"page-level-analytics","enabled":true,"variant":{"name":"disabled","enabled":false,"feature_enabled":true},"impressionData":false},{"name":"editor-version-history-v2","enabled":true,"variant":{"name":"disabled","enabled":false,"feature_enabled":true},"impressionData":false},{"name":"billing-page-v2","enabled":true,"variant":{"name":"disabled","enabled":false,"feature_enabled":true},"impressionData":false},{"name":"full-page-search","enabled":true,"variant":{"name":"disabled","enabled":false,"feature_enabled":true},"impressionData":false},{"name":"workspace-projects","enabled":true,"variant":{"name":"disabled","enabled":false,"feature_enabled":true},"impressionData":false},{"name":"assistant-v5","enabled":true,"variant":{"name":"disabled","enabled":false,"feature_enabled":true},"impressionData":false},{"name":"fork-pr-previews","enabled":true,"variant":{"name":"disabled","enabled":false,"feature_enabled":true},"impressionData":false},{"name":"revalidation-jwt","enabled":true,"variant":{"name":"disabled","enabled":false,"feature_enabled":true},"impressionData":false},{"name":"workos-sso-scim","enabled":true,"variant":{"name":"disabled","enabled":false,"feature_enabled":true},"impressionData":false},{"name":"hobby-abuse-scan","enabled":true,"variant":{"name":"disabled","enabled":false,"feature_enabled":true},"impressionData":false},{"name":"dashboard-inbox","enabled":true,"variant":{"name":"disabled","enabled":false,"feature_enabled":true},"impressionData":false},{"name":"workos-signup","enabled":true,"variant":{"name":"disabled","enabled":false,"feature_enabled":true},"impressionData":false},{"name":"turbopuffer-dual-write","enabled":true,"variant":{"name":"disabled","enabled":false,"feature_enabled":true},"impressionData":false},{"name":"workos-enabled","enabled":true,"variant":{"name":"disabled","enabled":false,"feature_enabled":true},"impressionData":false},{"name":"approve-review-flow","enabled":true,"variant":{"name":"disabled","enabled":false,"feature_enabled":true},"impressionData":false},{"name":"editor-metadata","enabled":true,"variant":{"name":"disabled","enabled":false,"feature_enabled":true},"impressionData":false},{"name":"sso-setup-deadline-banner","enabled":true,"variant":{"name":"disabled","enabled":false,"feature_enabled":true},"impressionData":false},{"name":"turbopuffer-serve","enabled":true,"variant":{"name":"disabled","enabled":false,"feature_enabled":true},"impressionData":false},{"name":"live-agents","enabled":true,"variant":{"name":"disabled","enabled":false,"feature_enabled":true},"impressionData":false},{"name":"comment-mode","enabled":true,"variant":{"name":"disabled","enabled":false,"feature_enabled":true},"impressionData":false}],"googleFontsInlined":false},"customCss":[{"filePath":"style.css","content":".tabs .overflow-x-auto{overflow-x:visible!important}a[href=\"https://github.com/langwatch/langwatch\"] .text-sm{white-space:nowrap}[aria-controls~=\"accordion\"]{padding-right:8px;padding-left:8px;align-items:start}[aria-controls~=\"accordion\"] p:last-child{font-size:14px;margin-top:0.5rem}[aria-controls~=\"accordion\"] [class=\"mr-0.5\"]{margin-top:5px}[aria-controls~=\"accordion\"][aria-expanded=\"true\"] [class=\"mr-0.5\"]{margin-top:8px}#sidebar-group .lg\\:text-sm{font-size:0.85rem!important}#sidebar-group .lg\\:leading-6{line-height:1.375rem!important}#sidebar-group .mb-5{margin-bottom:0.75rem!important}#sidebar-group .sm\\:mb-4{margin-bottom:0.5rem!important}#sidebar-group .py-1\\.5{padding-top:0.25rem!important;padding-bottom:0.25rem!important}#sidebar-group .mt-12 .lg\\:mt-8{margin-top:2rem!important}#sidebar-group .mb-3\\.5{margin-bottom:0.5rem!important}#sidebar-group h5{font-size:0.9rem!important}#sidebar-group svg{height:0.8rem!important;width:0.8rem!important}#sidebar-group svg[viewBox=\"0 -9 3 24\"]{stroke-width:1px!important;height:28px!important;width:12px!important;opacity:0.8!important}#sidebar-group .group{position:relative!important;padding-right:20px!important}#sidebar-group .group svg[viewBox=\"0 -9 3 24\"]{position:absolute!important;right:8px!important;top:50%!important;transform:translateY(-50%)!important}#sidebar-group .duration-75{transform:none!important}#sidebar-group .group svg[viewBox=\"0 -9 3 24\"].duration-75{transform:translateY(-50%)!important}#sidebar-group .group svg[viewBox=\"0 -9 3 24\"].duration-75.rotate-90{transform:translateY(-50%) rotate(90deg)!important}.line-highlight{background:rgb(85 215 153 / 0.2)!important}.line-highlight:before{background:rgb(85 215 153 / 0.2)!important;border-left:4px solid rgb(85 215 153)!important}.line-highlight:after{background:rgb(85 215 153 / 0.2)!important}code{max-width:100%;overflow-x:auto}.lw-copy-prompt{border:1px solid #e5e7eb;border-radius:12px;padding:12px 16px;display:flex;align-items:center;justify-content:space-between;gap:12px;cursor:pointer;transition:all 0.15s;margin-bottom:8px}.lw-copy-prompt:hover{background:#f9fafb}.lw-copy-btn{display:flex;align-items:center;gap:6px;padding:6px 12px;border-radius:8px;border:1px solid #e5e7eb;background:transparent;cursor:pointer;font-size:13px;font-weight:500;transition:all 0.15s;white-space:nowrap;color:inherit}.lw-copy-btn .lw-check-icon{display:none}.lw-copy-btn .lw-copy-icon{display:flex;align-items:center;gap:6px}.lw-copy-btn[data-copied] .lw-copy-icon{display:none}.lw-copy-btn[data-copied] .lw-check-icon{display:flex;align-items:center;gap:6px}.lw-copy-btn[data-copied]{background:#ecfdf5;color:#059669;border-color:#059669}.lw-copy-prompt[data-copied] .lw-copy-line-icon{display:none!important}.lw-copy-prompt[data-copied] .lw-copy-line-check{display:flex!important}.dark .lw-copy-prompt{border-color:#374151}.dark .lw-copy-prompt:hover{background:transparent;border-color:#6b7280}.dark .lw-copy-prompt:hover span{color:#f9fafb}.dark .lw-copy-btn{border-color:#374151}.dark .lw-copy-prompt:hover .lw-copy-btn{border-color:#6b7280;color:#f9fafb}.dark .lw-copy-btn[data-copied]{background:rgba(5, 150, 105, 0.15);border-color:rgba(5, 150, 105, 0.4);color:#059669}.lw-skill-install{border:1px solid #e5e7eb;border-radius:12px;padding:20px 24px;margin-bottom:16px}.lw-skill-install.lw-skill-highlighted{border-color:rgba(225, 113, 0, 0.4);background:rgba(225, 113, 0, 0.06)}.dark .lw-skill-install{border-color:#374151}.dark .lw-skill-install.lw-skill-highlighted{border-color:rgba(225, 113, 0, 0.4)}.lw-inline-copy-btn{display:inline-flex;align-items:center;padding:2px;border:none;background:transparent;color:#9ca3af;cursor:pointer;transition:color 0.15s;vertical-align:middle}.lw-inline-copy-btn:hover{color:#6b7280}.dark .lw-inline-copy-btn:hover{color:#d1d5db}.lw-info-box{display:flex;gap:12px;padding:16px;border:1px solid #e5e7eb;border-radius:12px;background:#f9fafb;margin-bottom:16px;margin-top:32px}.lw-info-box-icon{flex-shrink:0;color:#6b7280;margin-top:6px}.lw-info-box-content{flex:1;min-width:0;font-size:14px}.lw-info-box-content p{margin:0 0 8px}.lw-info-box-content p:last-child{margin-bottom:0}.lw-info-box-content pre{margin:8px 0 0!important}.lw-info-box-content [data-component-part=\"code-block-root\"]{padding-top:6px!important}.lw-info-box-content .code-block{margin-bottom:0!important}.dark .lw-info-box{border-color:#374151;background:rgba(255, 255, 255, 0.03)}.dark .lw-info-box-icon{color:#9ca3af}.lw-accordion{border:1px solid #e5e7eb;border-radius:12px;margin-bottom:8px;overflow:hidden}.lw-accordion-header{display:flex;align-items:center;justify-content:space-between;padding:12px 16px;cursor:pointer;transition:background 0.15s;list-style:none}.lw-accordion-header:hover{background:#f9fafb}.lw-accordion-title{font-size:14px}.lw-accordion-chevron{flex-shrink:0;transition:transform 0.2s;color:#9ca3af}.lw-accordion[data-open] .lw-accordion-chevron{transform:rotate(180deg)}.lw-accordion-body{display:none;padding:0 16px 16px;border-top:1px solid #e5e7eb}.lw-accordion[data-open] .lw-accordion-body{display:block}.lw-accordion-static .lw-accordion-header{cursor:default}.lw-accordion-static .lw-accordion-header:hover{background:transparent}.lw-prompt-source{display:none}.lw-accordion-commands{display:flex;gap:16px;margin-top:12px}.lw-accordion-cmd-col{flex:1;min-width:0}.lw-accordion-cmd-label{font-size:11px;font-weight:600;text-transform:uppercase;letter-spacing:0.05em;color:#6b7280;margin-bottom:6px}.lw-accordion-cmd-box{display:flex;align-items:center;gap:8px;padding:8px 12px;background:#f9fafb;border-radius:8px;border:1px solid #e5e7eb;cursor:pointer;transition:border-color 0.15s}.lw-accordion-cmd-box:hover{border-color:#d1d5db}.lw-accordion-cmd-box code{font-size:13px;font-family:var(--font-mono, monospace);white-space:nowrap;overflow:hidden;text-overflow:ellipsis;flex:1;min-width:0;background:transparent!important;padding:0!important;border:none!important}.lw-slash-command{color:#e17100;font-weight:600}.lw-accordion-cmd-box[data-copied]{border-color:#059669;background:#ecfdf5}.lw-accordion-cmd-box[data-copied] .lw-copy-line-icon{display:none!important}.lw-accordion-cmd-box[data-copied] .lw-copy-line-check{display:inline-flex!important}.lw-accordion-actions{display:flex;flex-wrap:wrap;gap:8px;margin-top:12px}.lw-accordion-action{display:flex;align-items:center;gap:8px;padding:6px 12px 6px 6px;border:1px solid #e5e7eb;border-radius:8px;background:transparent;cursor:pointer;text-decoration:none;color:inherit;transition:all 0.15s;text-align:left}.lw-accordion-action:hover{background:#f9fafb;border-color:#d1d5db}.lw-accordion-action-icon{display:flex;align-items:center;justify-content:center;width:32px;height:32px;border:1px solid #e5e7eb;border-radius:6px;color:#6b7280;flex-shrink:0}.lw-accordion-action-text{display:flex;flex-direction:column;line-height:1.2}.lw-accordion-action-title{font-size:13px;font-weight:500}.lw-accordion-action-subtitle{font-size:11px;font-weight:400;color:#9ca3af}.lw-accordion-action[data-copied]{background:#ecfdf5;border-color:#059669}.lw-accordion-action[data-copied] .lw-copy-line-icon{display:none!important}.lw-accordion-action[data-copied] .lw-copy-line-check{display:flex!important}.dark .lw-accordion{border-color:#374151}.dark .lw-accordion-header:hover{background:rgba(255, 255, 255, 0.03)}.dark .lw-accordion-static .lw-accordion-header:hover{background:transparent}.dark .lw-accordion-body{border-top-color:#374151}.dark .lw-accordion-cmd-box{background:rgba(255, 255, 255, 0.05);border-color:#374151}.dark .lw-accordion-cmd-box:hover{border-color:#6b7280}.dark .lw-accordion-cmd-box[data-copied]{background:rgba(5, 150, 105, 0.15);border-color:rgba(5, 150, 105, 0.4)}.dark .lw-accordion-action{border-color:#374151}.dark .lw-accordion-action-icon{border-color:#374151}.dark .lw-accordion-action:hover{background:rgba(255, 255, 255, 0.03);border-color:#6b7280}.dark .lw-accordion-action[data-copied]{background:rgba(5, 150, 105, 0.15);border-color:rgba(5, 150, 105, 0.4)}.dark .lw-accordion-chevron{color:#6b7280}.dark .lw-slash-command{color:#fe9a00}#sidebar-group .group>img{align-self:center}#footer{flex-wrap:wrap;row-gap:0}.lw-agent-report{flex:0 0 100%;font-size:14px;color:#9ca3af;padding-bottom:12px}.lw-agent-report a{color:inherit;text-decoration:underline;text-underline-offset:2px}.lw-agent-report a:hover{color:#6b7280}.lw-agent-report code{font-size:13px;white-space:nowrap;background:rgba(0, 0, 0, 0.04);border:1px solid #e5e7eb;border-radius:4px;padding:1px 5px}.dark .lw-agent-report{color:#6b7280}.dark .lw-agent-report a:hover{color:#9ca3af}.dark .lw-agent-report code{background:rgba(255, 255, 255, 0.05);border-color:#374151}"}],"page":{"pagePath":"self-hosting/ops/dashboard","slug":"/self-hosting/ops/dashboard","pageMetadata":{"title":"Ops Dashboard","description":"Real-time pipeline health monitoring with throughput, latency, and error tracking","href":"/self-hosting/ops/dashboard"},"description":{"compiledSource":"\"use strict\";\nconst {jsx: _jsx} = arguments[0];\nconst {useMDXComponents: _provideComponents} = arguments[0];\nfunction _createMdxContent(props) {\n const _components = {\n p: \"p\",\n ..._provideComponents(),\n ...props.components\n };\n return _jsx(_components.p, {\n children: \"Real-time pipeline health monitoring with throughput, latency, and error tracking\"\n });\n}\nfunction MDXContent(props = {}) {\n const {wrapper: MDXLayout} = {\n ..._provideComponents(),\n ...props.components\n };\n return MDXLayout ? _jsx(MDXLayout, {\n ...props,\n children: _jsx(_createMdxContent, {\n ...props\n })\n }) : _createMdxContent(props);\n}\nreturn {\n default: MDXContent\n};\n","frontmatter":{},"scope":{}},"pageType":"default","mdx":{"mdxSource":{"compiledSource":"\"use strict\";const{Fragment:_Fragment,jsx:_jsx,jsxs:_jsxs}=arguments[0];const{useMDXComponents:_provideComponents}=arguments[0];function _createMdxContent(props){const _components={a:`a`,code:`code`,li:`li`,p:`p`,strong:`strong`,tbody:`tbody`,td:`td`,th:`th`,thead:`thead`,tr:`tr`,ul:`ul`,..._provideComponents(),...props.components},{Frame,Heading,OptimizedImage,Table,Tip}=_components;if(!Frame)_missingMdxReference(`Frame`,true);if(!Heading)_missingMdxReference(`Heading`,true);if(!OptimizedImage)_missingMdxReference(`OptimizedImage`,true);if(!Table)_missingMdxReference(`Table`,true);if(!Tip)_missingMdxReference(`Tip`,true);return _jsxs(_Fragment,{children:[_jsxs(_components.p,{children:[`The Ops Dashboard is the landing page of the Operations Console (`,_jsx(_components.code,{children:`/ops`}),`). It provides a real-time view of the event-sourcing pipeline, ingestion rates, processing throughput, latency percentiles, queue health, and top errors, all in a single screen.`]}),`\n`,_jsx(Frame,{children:_jsx(OptimizedImage,{src:`https://mintcdn.com/langwatch/Bcv1mdi2Gl7gtdK5/images/ops/dashboard.png?fit=max\u0026auto=format\u0026n=Bcv1mdi2Gl7gtdK5\u0026q=85\u0026s=7a47f7ddda9798675b2652c7c2d6a981`,alt:`Ops Dashboard`,\"data-og-width\":`1280`,width:`1280`,\"data-og-height\":`581`,height:`581`,\"data-path\":`images/ops/dashboard.png`,\"data-optimize\":`true`,\"data-opv\":`3`,srcset:`https://mintcdn.com/langwatch/Bcv1mdi2Gl7gtdK5/images/ops/dashboard.png?w=280\u0026fit=max\u0026auto=format\u0026n=Bcv1mdi2Gl7gtdK5\u0026q=85\u0026s=1cd628813b0f6b20723979cbc2d1dfcc 280w, https://mintcdn.com/langwatch/Bcv1mdi2Gl7gtdK5/images/ops/dashboard.png?w=560\u0026fit=max\u0026auto=format\u0026n=Bcv1mdi2Gl7gtdK5\u0026q=85\u0026s=54c0c622b14d079976ea0781d12cbee0 560w, https://mintcdn.com/langwatch/Bcv1mdi2Gl7gtdK5/images/ops/dashboard.png?w=840\u0026fit=max\u0026auto=format\u0026n=Bcv1mdi2Gl7gtdK5\u0026q=85\u0026s=1f18b421f4f68440ef015e90a75fccb6 840w, https://mintcdn.com/langwatch/Bcv1mdi2Gl7gtdK5/images/ops/dashboard.png?w=1100\u0026fit=max\u0026auto=format\u0026n=Bcv1mdi2Gl7gtdK5\u0026q=85\u0026s=9d58ca852d0679bdf0edb7a2bb06e262 1100w, https://mintcdn.com/langwatch/Bcv1mdi2Gl7gtdK5/images/ops/dashboard.png?w=1650\u0026fit=max\u0026auto=format\u0026n=Bcv1mdi2Gl7gtdK5\u0026q=85\u0026s=b2d8afb15735ba707e9be24437ee919a 1650w, https://mintcdn.com/langwatch/Bcv1mdi2Gl7gtdK5/images/ops/dashboard.png?w=2500\u0026fit=max\u0026auto=format\u0026n=Bcv1mdi2Gl7gtdK5\u0026q=85\u0026s=2397bb69d29e9b0f98255d9e034e23e8 2500w`})}),`\n`,_jsx(Heading,{level:`2`,id:`metrics-overview`,children:`Metrics Overview`}),`\n`,_jsx(_components.p,{children:`The top of the dashboard displays six key metrics, each showing the current rate and a secondary stat (peak, total, or count):`}),`\n`,_jsxs(Table,{children:[_jsx(_components.thead,{children:_jsxs(_components.tr,{children:[_jsx(_components.th,{children:`Metric`}),_jsx(_components.th,{children:`What it measures`}),_jsx(_components.th,{children:`Secondary stat`})]})}),_jsxs(_components.tbody,{children:[_jsxs(_components.tr,{children:[_jsx(_components.td,{children:_jsx(_components.strong,{children:`Staged/s`})}),_jsx(_components.td,{children:`Ingestion rate, commands entering the queue`}),_jsx(_components.td,{children:`Peak rate`})]}),_jsxs(_components.tr,{children:[_jsx(_components.td,{children:_jsx(_components.strong,{children:`Completed/s`})}),_jsx(_components.td,{children:`Processing throughput, commands fully processed`}),_jsx(_components.td,{children:`Total completed`})]}),_jsxs(_components.tr,{children:[_jsx(_components.td,{children:_jsx(_components.strong,{children:`Failed/s`})}),_jsx(_components.td,{children:`Failure rate, commands that errored`}),_jsx(_components.td,{children:`Total failed`})]}),_jsxs(_components.tr,{children:[_jsx(_components.td,{children:_jsx(_components.strong,{children:`Blocked`})}),_jsx(_components.td,{children:`Groups stuck due to errors`}),_jsx(_components.td,{children:`Number of error groups`})]}),_jsxs(_components.tr,{children:[_jsx(_components.td,{children:_jsx(_components.strong,{children:`DLQ`})}),_jsx(_components.td,{children:`Items in the Dead Letter Queue`}),_jsx(_components.td,{children:`Redis memory usage`})]}),_jsxs(_components.tr,{children:[_jsx(_components.td,{children:_jsx(_components.strong,{children:`P50, P99`})}),_jsx(_components.td,{children:`End-to-end processing latency`}),_jsx(_components.td,{children:`Peak latency`})]})]})]}),`\n`,_jsx(Tip,{children:_jsx(_components.p,{children:`Metrics marked in red indicate an active problem, non-zero failure rates or blocked groups. Orange\nindicates a warning state, such as items in the DLQ.`})}),`\n`,_jsx(Heading,{level:`2`,id:`active-operations`,children:`Active Operations`}),`\n`,_jsxs(_components.p,{children:[`When a `,_jsx(_components.a,{href:`/self-hosting/ops/projection-replay`,children:`projection replay`}),` is running or pipelines are paused, a banner appears below the metrics showing:`]}),`\n`,_jsxs(_components.ul,{children:[`\n`,_jsxs(_components.li,{children:[_jsx(_components.strong,{children:`Replay status`}),` with the current projection name and a link to the detailed progress view`]}),`\n`,_jsxs(_components.li,{children:[_jsx(_components.strong,{children:`Paused pipelines`}),` listed as orange badges`]}),`\n`]}),`\n`,_jsx(Heading,{level:`2`,id:`throughput-chart`,children:`Throughput Chart`}),`\n`,_jsx(_components.p,{children:`A time-series chart tracks throughput over time, showing staged, completed, and failed rates. Use this to identify processing backlogs (staged >> completed) or failure spikes.`}),`\n`,_jsx(Heading,{level:`2`,id:`pipeline-tree`,children:`Pipeline Tree`}),`\n`,_jsx(_components.p,{children:`The pipeline tree shows the hierarchical structure of all processing pipelines. Each node represents a pipeline stage.`}),`\n`,_jsxs(_components.p,{children:[`Operators with `,_jsx(_components.code,{children:`ops:manage`}),` permission can `,_jsx(_components.strong,{children:`pause`}),` and `,_jsx(_components.strong,{children:`unpause`}),` individual pipeline stages directly from the tree. Pausing a stage prevents new jobs from being consumed while allowing in-flight jobs to complete.`]}),`\n`,_jsx(Heading,{level:`2`,id:`top-errors`,children:`Top Errors`}),`\n`,_jsx(_components.p,{children:`The bottom of the dashboard lists the top error patterns across all queues, showing:`}),`\n`,_jsxs(_components.ul,{children:[`\n`,_jsxs(_components.li,{children:[_jsx(_components.strong,{children:`Count`}),`: how many jobs hit this error`]}),`\n`,_jsxs(_components.li,{children:[_jsx(_components.strong,{children:`Error message`}),`: normalized and deduplicated`]}),`\n`,_jsxs(_components.li,{children:[_jsx(_components.strong,{children:`Pipeline`}),`: which pipeline stage produced the error`]}),`\n`]}),`\n`,_jsx(_components.p,{children:`This gives a quick signal on whether errors are concentrated in a single pipeline or scattered across the system.`}),`\n`,_jsx(Heading,{level:`2`,id:`real-time-updates`,children:`Real-Time Updates`}),`\n`,_jsxs(_components.p,{children:[`The dashboard uses `,_jsx(_components.strong,{children:`Server-Sent Events (SSE)`}),` for real-time metric streaming. A connection status indicator in the header shows:`]}),`\n`,_jsxs(_components.ul,{children:[`\n`,_jsxs(_components.li,{children:[_jsx(_components.strong,{children:`Connected`}),` (green), live SSE connection active`]}),`\n`,_jsxs(_components.li,{children:[_jsx(_components.strong,{children:`Polling`}),` (yellow), SSE unavailable, falling back to 5-second polling`]}),`\n`,_jsxs(_components.li,{children:[_jsx(_components.strong,{children:`Disconnected`}),` (red), no connection`]}),`\n`]}),`\n`,_jsx(_components.p,{children:`Both modes deliver the same data; SSE provides lower-latency updates.`}),`\n`,_jsx(Heading,{level:`2`,id:`replay-history`,children:`Replay History`}),`\n`,_jsxs(_components.p,{children:[`A compact section at the bottom shows the latest projection replay run with its status, duration, and description. Click it to navigate to the full `,_jsx(_components.a,{href:`/self-hosting/ops/projection-replay`,children:`replay detail view`}),`.`]})]})}function MDXContent(props={}){const{wrapper:MDXLayout}={..._provideComponents(),...props.components};return MDXLayout?_jsx(MDXLayout,{...props,children:_jsx(_createMdxContent,{...props})}):_createMdxContent(props)}return{default:MDXContent};function _missingMdxReference(id,component){throw new Error(`Expected `+(component?`component`:`object`)+\" `\"+id+\"` to be defined: you likely forgot to import, pass, or provide it.\")}","frontmatter":{},"scope":{"config":{},"pageMetadata":{"title":"Ops Dashboard","description":"Real-time pipeline health monitoring with throughput, latency, and error tracking","href":"/self-hosting/ops/dashboard"}}},"mdxSourceWithNoJs":null},"mdxExtracts":{"tableOfContents":[{"title":"Metrics Overview","slug":"metrics-overview","depth":2,"children":[]},{"title":"Active Operations","slug":"active-operations","depth":2,"children":[]},{"title":"Throughput Chart","slug":"throughput-chart","depth":2,"children":[]},{"title":"Pipeline Tree","slug":"pipeline-tree","depth":2,"children":[]},{"title":"Top Errors","slug":"top-errors","depth":2,"children":[]},{"title":"Real-Time Updates","slug":"real-time-updates","depth":2,"children":[]},{"title":"Replay History","slug":"replay-history","depth":2,"children":[]}],"codeExamples":{}},"jsLinks":["/docs/_mintlify/custom/langwatch/1c7dbbb4aa0b0c87/expand-menus.js","/docs/_mintlify/custom/langwatch/fdd2d1ee81d630a0/posthog.js"],"subdomain":"langwatch","siteName":"LangWatch","title":"Ops Dashboard - LangWatch","navMaps":{"firstHrefInVersion":{},"firstHrefInLanguage":{}},"lastModified":"2026-10-12T08:13:41.805Z","gitLastModified":"2026-10-12T08:12:32.000Z","originalFileLocation":"self-hosting/ops/dashboard.mdx"},"headHtml":"\u003cscript data-mint-head>(function(){var d=document.documentElement,p=null;if(!p){try{p=localStorage.getItem(\"isDarkMode\")}catch(e){}if(p==='true')p='dark';else if(p==='false')p='light';if(p!=='light'\u0026\u0026p!=='dark'\u0026\u0026p!=='system')p=\"system\"}var r=p==='system'?(matchMedia(\"(prefers-color-scheme: dark)\").matches?'dark':'light'):p;d.classList.remove(r==='dark'?'light':'dark');d.classList.add(r);d.setAttribute(\"data-theme-preference\",p)})();\u003c/script>\u003cmeta data-mint-head name=\"description\" content=\"Real-time pipeline health monitoring with throughput, latency, and error tracking\">\u003cmeta data-mint-head name=\"application-name\" content=\"LangWatch\">\u003cmeta data-mint-head name=\"generator\" content=\"Mintlify\">\u003clink data-mint-head rel=\"icon\" type=\"image/png\" sizes=\"192x192\" href=\"/docs/mintlify-assets/_mintlify/favicons/langwatch/kXoUUhFGtPYqSZK4/_generated/favicon/android-chrome-192x192.png\" media=\"(prefers-color-scheme: light)\">\u003clink data-mint-head rel=\"apple-touch-icon\" type=\"image/png\" sizes=\"180x180\" href=\"/docs/mintlify-assets/_mintlify/favicons/langwatch/kXoUUhFGtPYqSZK4/_generated/favicon/apple-touch-icon.png\">\u003clink data-mint-head rel=\"icon\" type=\"image/png\" sizes=\"16x16\" href=\"/docs/mintlify-assets/_mintlify/favicons/langwatch/kXoUUhFGtPYqSZK4/_generated/favicon/favicon-16x16.png\" media=\"(prefers-color-scheme: light)\">\u003clink data-mint-head rel=\"icon\" type=\"image/png\" sizes=\"32x32\" href=\"/docs/mintlify-assets/_mintlify/favicons/langwatch/kXoUUhFGtPYqSZK4/_generated/favicon/favicon-32x32.png\" media=\"(prefers-color-scheme: light)\">\u003clink data-mint-head rel=\"shortcut icon\" type=\"image/x-icon\" href=\"/docs/mintlify-assets/_mintlify/favicons/langwatch/kXoUUhFGtPYqSZK4/_generated/favicon/favicon.ico\" media=\"(prefers-color-scheme: light)\">\u003clink data-mint-head rel=\"icon\" type=\"image/png\" sizes=\"192x192\" href=\"/docs/mintlify-assets/_mintlify/favicons/langwatch/kXoUUhFGtPYqSZK4/_generated/favicon-dark/android-chrome-192x192.png\" media=\"(prefers-color-scheme: dark)\">\u003clink data-mint-head rel=\"icon\" type=\"image/png\" sizes=\"16x16\" href=\"/docs/mintlify-assets/_mintlify/favicons/langwatch/kXoUUhFGtPYqSZK4/_generated/favicon-dark/favicon-16x16.png\" media=\"(prefers-color-scheme: dark)\">\u003clink data-mint-head rel=\"icon\" type=\"image/png\" sizes=\"32x32\" href=\"/docs/mintlify-assets/_mintlify/favicons/langwatch/kXoUUhFGtPYqSZK4/_generated/favicon-dark/favicon-32x32.png\" media=\"(prefers-color-scheme: dark)\">\u003clink data-mint-head rel=\"shortcut icon\" type=\"image/x-icon\" href=\"/docs/mintlify-assets/_mintlify/favicons/langwatch/kXoUUhFGtPYqSZK4/_generated/favicon-dark/favicon.ico\" media=\"(prefers-color-scheme: dark)\">\u003cmeta data-mint-head property=\"og:title\" content=\"Ops Dashboard - LangWatch\">\u003cmeta data-mint-head property=\"og:description\" content=\"Real-time pipeline health monitoring with throughput, latency, and error tracking\">\u003cmeta data-mint-head property=\"og:site_name\" content=\"LangWatch\">\u003cmeta data-mint-head property=\"og:url\" content=\"https://langwatch.ai/docs/self-hosting/ops/dashboard\">\u003cmeta data-mint-head property=\"og:type\" content=\"website\">\u003cmeta data-mint-head property=\"og:image\" content=\"https://langwatch.mintlify.site/docs/_mintlify/api/og/v2?division=Ops+Console\u0026amp;title=Ops+Dashboard\u0026amp;description=Real-time+pipeline+health+monitoring+with+throughput%2C+latency%2C+and+error+tracking\u0026amp;theme=c82022416a7a1873b973b6a4\u0026amp;signature=2220c44a90422f46a7f45fdbfcf96089c133080112c7da29e3ae83e4b1e455ca\">\u003cmeta data-mint-head property=\"og:image:width\" content=\"1200\">\u003cmeta data-mint-head property=\"og:image:height\" content=\"630\">\u003cmeta data-mint-head name=\"twitter:card\" content=\"summary_large_image\">\u003cmeta data-mint-head name=\"twitter:title\" content=\"Ops Dashboard - LangWatch\">\u003cmeta data-mint-head name=\"twitter:description\" content=\"Real-time pipeline health monitoring with throughput, latency, and error tracking\">\u003cmeta data-mint-head name=\"twitter:image\" content=\"https://langwatch.mintlify.site/docs/_mintlify/api/og/v2?division=Ops+Console\u0026amp;title=Ops+Dashboard\u0026amp;description=Real-time+pipeline+health+monitoring+with+throughput%2C+latency%2C+and+error+tracking\u0026amp;theme=c82022416a7a1873b973b6a4\u0026amp;signature=2220c44a90422f46a7f45fdbfcf96089c133080112c7da29e3ae83e4b1e455ca\">\u003cmeta data-mint-head name=\"twitter:image:width\" content=\"1200\">\u003cmeta data-mint-head name=\"twitter:image:height\" content=\"630\">\u003cmeta data-mint-head name=\"msapplication-config\" content=\"/docs/mintlify-assets/_mintlify/favicons/langwatch/kXoUUhFGtPYqSZK4/_generated/favicon/browserconfig.xml\">\u003cmeta data-mint-head name=\"apple-mobile-web-app-title\" content=\"LangWatch\">\u003cmeta data-mint-head name=\"msapplication-TileColor\" content=\"#e17100\">\u003clink data-mint-head rel=\"canonical\" href=\"https://langwatch.ai/docs/self-hosting/ops/dashboard\">\u003clink data-mint-head rel=\"alternate\" type=\"application/xml\" href=\"/docs/sitemap.xml\">\u003clink data-mint-head rel=\"alternate\" type=\"text/markdown\" href=\"/docs/self-hosting/ops/dashboard.md\">\u003cscript data-mint-head type=\"application/ld+json\">{\"@context\":\"https://schema.org\",\"@graph\":[{\"@type\":\"Organization\",\"@id\":\"https://langwatch.ai/#organization\",\"name\":\"LangWatch\",\"url\":\"https://langwatch.ai\",\"logo\":{\"@type\":\"ImageObject\",\"url\":\"https://langwatch.ai/docs/logo/light.svg\"},\"sameAs\":[\"https://github.com/langwatch/langwatch\",\"https://x.com/langwatchai\",\"https://www.linkedin.com/company/langwatch/\",\"https://www.youtube.com/@LangWatch\"]},{\"@type\":\"WebSite\",\"@id\":\"https://langwatch.ai/docs#website\",\"name\":\"LangWatch\",\"url\":\"https://langwatch.ai/docs\",\"publisher\":{\"@id\":\"https://langwatch.ai/#organization\"}},{\"@type\":\"WebPage\",\"@id\":\"https://langwatch.ai/docs/self-hosting/ops/dashboard#webpage\",\"url\":\"https://langwatch.ai/docs/self-hosting/ops/dashboard\",\"name\":\"Ops Dashboard\",\"description\":\"Real-time pipeline health monitoring with throughput, latency, and error tracking\",\"dateModified\":\"2026-10-12T08:12:32.000Z\",\"isPartOf\":{\"@id\":\"https://langwatch.ai/docs#website\"},\"breadcrumb\":{\"@id\":\"https://langwatch.ai/docs/self-hosting/ops/dashboard#breadcrumb\"}},{\"@type\":\"BreadcrumbList\",\"@id\":\"https://langwatch.ai/docs/self-hosting/ops/dashboard#breadcrumb\",\"itemListElement\":[{\"@type\":\"ListItem\",\"position\":1,\"name\":\"Ops Console\",\"item\":\"https://langwatch.ai/docs/self-hosting/ops/overview\"},{\"@type\":\"ListItem\",\"position\":2,\"name\":\"Ops Dashboard\",\"item\":\"https://langwatch.ai/docs/self-hosting/ops/dashboard\"}]},{\"@type\":[\"Article\",\"TechArticle\"],\"@id\":\"https://langwatch.ai/docs/self-hosting/ops/dashboard#article\",\"headline\":\"Ops Dashboard\",\"name\":\"Ops Dashboard\",\"description\":\"Real-time pipeline health monitoring with throughput, latency, and error tracking\",\"url\":\"https://langwatch.ai/docs/self-hosting/ops/dashboard\",\"mainEntityOfPage\":{\"@id\":\"https://langwatch.ai/docs/self-hosting/ops/dashboard#webpage\"},\"dateModified\":\"2026-10-12T08:12:32.000Z\",\"publisher\":{\"@id\":\"https://langwatch.ai/#organization\"},\"isPartOf\":{\"@id\":\"https://langwatch.ai/docs#website\"}}]}\u003c/script>\u003cscript data-mint-head type=\"application/ld+json\">{\"@context\":\"https://schema.org\",\"@type\":\"WebSite\",\"name\":\"LangWatch\",\"creator\":{\"@type\":\"Organization\",\"name\":\"Mintlify\",\"url\":\"https://mintlify.com\"}}\u003c/script>","siteName":"LangWatch","nav":{"global":{"anchors":[{"anchor":"Get Support","icon":"life-ring","href":"https://docs.langwatch.ai/support#email-support"}]},"anchors":[{"anchor":"Platform","icon":"book-open","pages":[{"title":"Platform","href":"/introduction"}]},{"anchor":"Observability","icon":"plug","pages":[{"title":"Observability","href":"/integration/overview"}]},{"anchor":"AI Gateway","icon":"route","pages":[{"title":"AI Gateway","href":"/ai-gateway/overview"}]},{"anchor":"AI Governance","icon":"shield-check","pages":[{"title":"AI Governance","href":"/ai-governance/overview"}]},{"anchor":"Coding Agents","icon":"square-terminal","pages":[{"title":"Coding Agents","href":"/coding-agents/overview"}]},{"anchor":"Langy","icon":"robot","pages":[{"title":"Langy","href":"/langy/overview"}]},{"anchor":"Self Hosting","icon":"server","groups":[{"group":"Overview","pages":[{"title":"Self-Hosting Overview","href":"/self-hosting/overview"},{"title":"First run","sidebarTitle":"First run","href":"/self-hosting/first-run"},{"title":"Editions and licensing","sidebarTitle":"Editions \u0026 licensing","href":"/self-hosting/licensing"},{"title":"Connect: hosted services for a self-hosted install","sidebarTitle":"Connect","href":"/self-hosting/connect"},{"title":"Data and telemetry: every outbound connection","sidebarTitle":"Data and telemetry","href":"/self-hosting/data-and-telemetry"},{"title":"Usage report dictionary: every field an install sends","sidebarTitle":"Usage report dictionary","href":"/self-hosting/usage-report-dictionary"},{"title":"Hybrid Setup","href":"/hybrid-setup/overview"},{"title":"Checkup","href":"/self-hosting/checkup"},{"title":"Troubleshooting \u0026 FAQ","href":"/self-hosting/troubleshooting"}]},{"group":"Configuration","pages":[{"title":"Environment Variables","href":"/self-hosting/configuration/environment-variables"},{"title":"Sizing \u0026 Scaling","href":"/self-hosting/configuration/sizing-and-scaling"},{"title":"Backups","href":"/self-hosting/configuration/backups"},{"title":"Object Storage Lifecycle","href":"/self-hosting/configuration/object-storage-lifecycle"},{"title":"SSO Configuration","href":"/self-hosting/configuration/sso"},{"title":"Email","href":"/self-hosting/configuration/email"},{"title":"Observability \u0026 Monitoring","href":"/self-hosting/configuration/observability"},{"title":"Third-Party Integrations","href":"/self-hosting/configuration/third-party-integrations"},{"title":"Webhooks \u0026 Billing Events","sidebarTitle":"Webhooks \u0026 Billing","href":"/self-hosting/webhooks"}]},{"group":"Deployment","pages":[{"title":"Docker Compose","href":"/self-hosting/deployment/docker-compose"},{"title":"Docker Images","href":"/self-hosting/deployment/docker-images"},{"title":"Kubernetes (Helm)","href":"/self-hosting/deployment/kubernetes-helm"},{"title":"Local Kubernetes (Kind + Helm)","href":"/self-hosting/deployment/kubernetes-local"},{"title":"ArgoCD","href":"/self-hosting/deployment/argocd"},{"title":"Routing and ingress controllers","sidebarTitle":"Routing","href":"/self-hosting/deployment/routing"}]},{"group":"Infrastructure","pages":[{"title":"Architecture \u0026 Infrastructure","href":"/self-hosting/infrastructure/architecture"}]},{"group":"Operations","pages":[{"title":"Security","href":"/self-hosting/security"},{"title":"Self-hosting compliance","sidebarTitle":"Compliance","href":"/self-hosting/compliance"},{"title":"Releases and support","href":"/self-hosting/releases"},{"title":"Upgrade Guide","href":"/self-hosting/upgrade"},{"title":"Migrate to v3","href":"/self-hosting/upgrade-v3"},{"title":"Dataset Storage Migration","href":"/self-hosting/upgrade-dataset-storage"}]},{"group":"Ops Console","pages":[{"title":"Operations Console","description":"Run your LangWatch installation: inspect queues, recover processing and support identity or directory issues.","href":"/self-hosting/ops/overview"},{"title":"Ops Dashboard","href":"/self-hosting/ops/dashboard"},{"title":"Queue Management","description":"Manage error groups, blocked queues, dead letter queue redriving, and draining","href":"/self-hosting/ops/queue-management"},{"title":"Projection Replay","href":"/self-hosting/ops/projection-replay"},{"title":"Deja View","href":"/self-hosting/ops/dejaview"},{"title":"The Foundry","href":"/self-hosting/ops/foundry"}]},{"group":"Langy","pages":[{"title":"Self-Hosting Langy","sidebarTitle":"Overview","href":"/self-hosting/langy/overview"},{"title":"Langy Assistant","sidebarTitle":"Setup","href":"/self-hosting/langy/setup"},{"title":"Register the GitHub App","sidebarTitle":"GitHub App","href":"/self-hosting/langy/github-app"},{"title":"Langy Environment Variables","sidebarTitle":"Environment variables","href":"/self-hosting/langy/environment-variables"},{"title":"Langy Networking and Egress","sidebarTitle":"Networking and egress","href":"/self-hosting/langy/networking-and-egress"},{"title":"Langy Health Check","sidebarTitle":"Health check","href":"/self-hosting/langy/health-check"}]}]},{"anchor":"API Reference","icon":"code","pages":[{"title":"API Reference","href":"/api-reference/introduction"}]}]},"basePath":"","title":"Ops Dashboard - LangWatch","buildId":"dpl_ATnXPMW25DMPUr9VBw6kL6MfBt6T","deploymentId":"dpl_ATnXPMW25DMPUr9VBw6kL6MfBt6T","dynamics":["10e4515597","07c022d89b","a74be98ba7"],"chunks":["BannerMarkdown-B5WzX-8C.js","dist-BPypQKlo.js","lib-DuNMoZ05.js","lib-B8HbPgcC.js","clsx-6wHzaN2_.js","html-void-elements-mCSPHezU.js","katex-YMM-FMeD.js","marked.esm-CZWythHk.js","Frame-BDAj7nBh.js","DynamicMarkdown-Bq09mRwR.js","zoom-image-lightbox-CypZe82l.js","lightbox-handle-r17bVUz3.js"]}